52
· Black 0x0000 (0)
· White 0xFFFF (65535)
· Red 0xF800 (63488)
· Green 0x07E0 (2016)
· Blue 0x001F (31)
· Cyan 0x07FF (2047)
· Yellow 0xFFE0 (65504)
Typically, a function table will be used to map a given value to a specific color. To avoid interpolation between
the color values, the function table should be set up such that a range of values defines one color. For
example, the following function table would map brake temperatures of 0 to 250 to blue, 251 to 500 to green,
501 to 700 to yellow and 701 to 1000 to red:
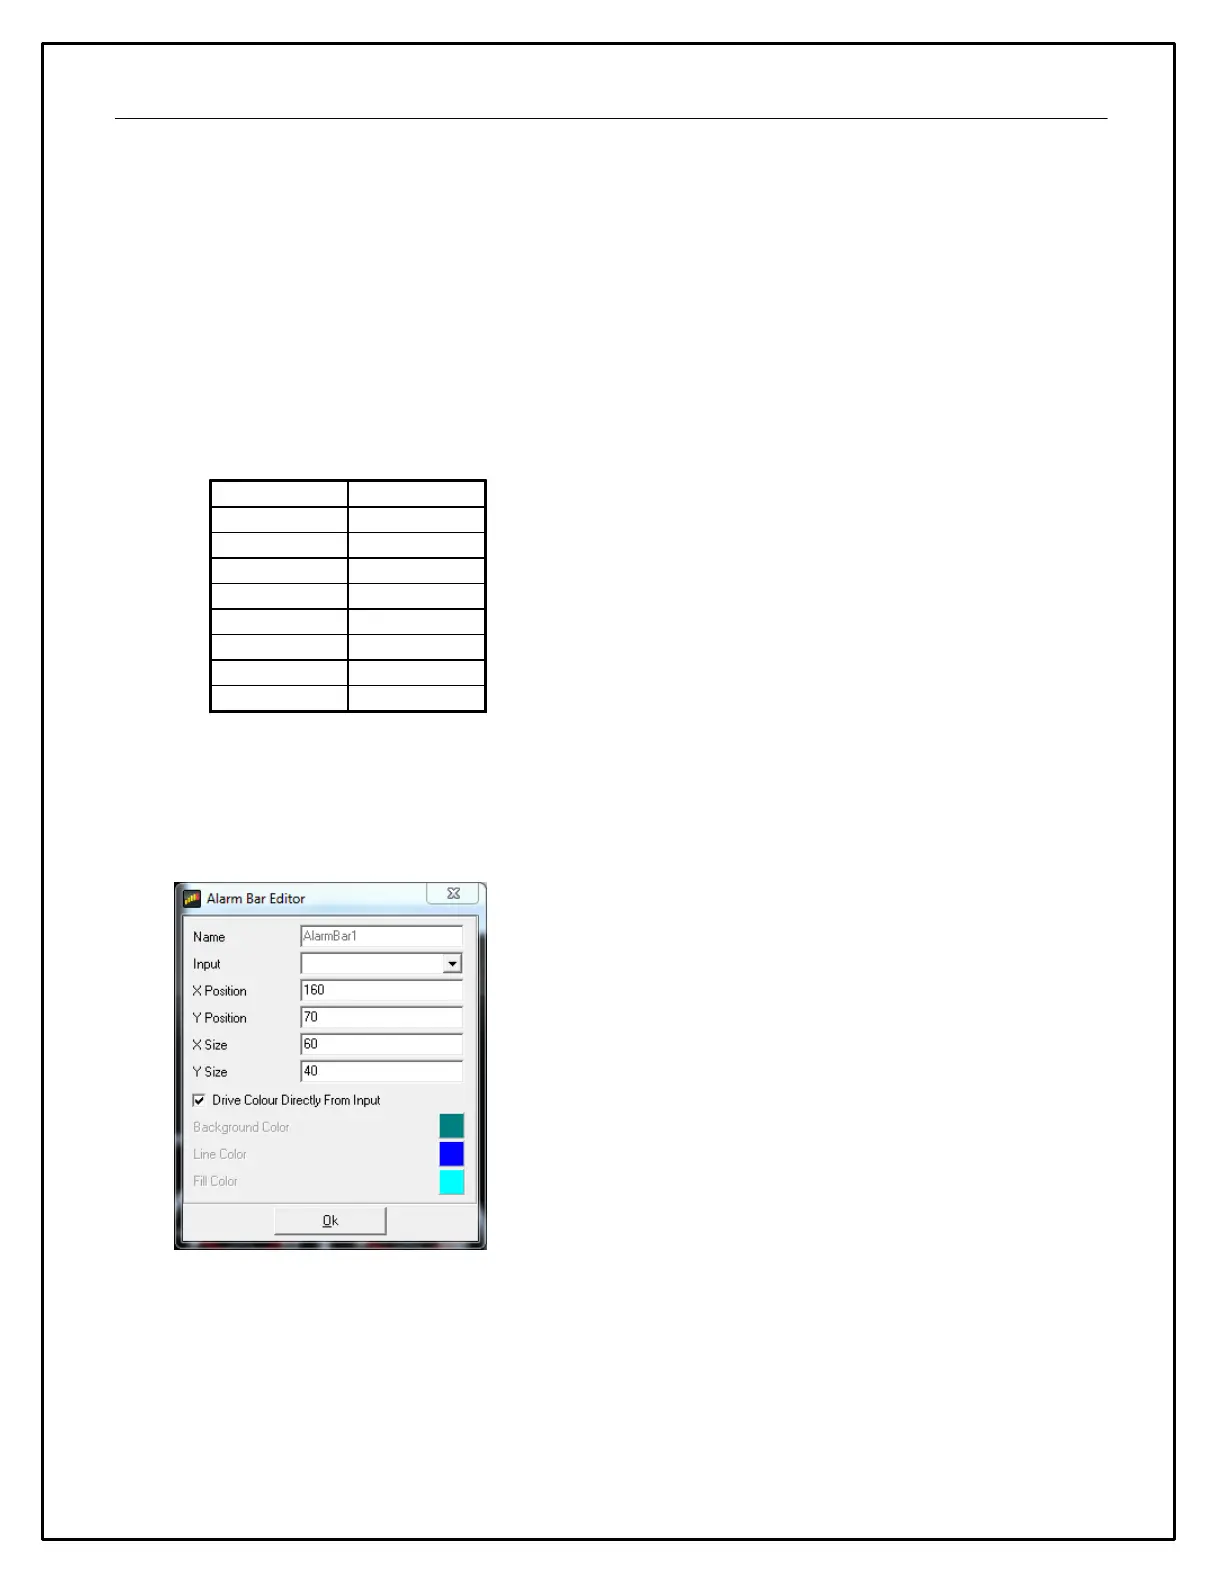
Note that it is also possible to display an alarm bar underneath a value gauge. For this to work correctly, the
alarm bar must be bigger than the maximum likely size of the value gauge. When setting this up in the editor, it
is easier to add the alarm bar to the page first then the value gauge; this ensures that the value gauge is visible
and makes sizing the alarm bar correctly easier. If you have trouble selecting an item to edit, you can adjust
it’s Z-Order to push it behind other objects.
Shape Gauges
Shape gauges are static gauges (i.e. have no input) that are used to draw shapes on the screen. They have
two special properties:
· Shape specifies the basic shape as either a Rectangle or an Ellipse.
· Thickness specifies the thickness of the border drawn around the shape.

 Loading...