36 37
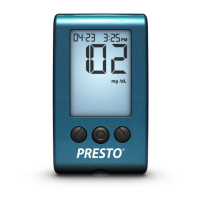
[2] Press the DOWN ( ) or UP ( ) arrow
buttons until the abbreviation “GRAPH”
appears in the lower part of the display.
[3] Press the CHECK (
) button again to enter
the graph section. The display now shows your
1 month graph.
[4] Press the DOWN (
) arrow button. The
display now shows your 2 week trend graph.
[5] Press the DOWN (
) arrow button. The
display now shows your 3 day trend graph.
Note: Press the UP (
) arrow button to scroll
backwards. When scrolling, you will cycle through
the Trend Graphs. To return to the menu, press the
CHECK (
) button.
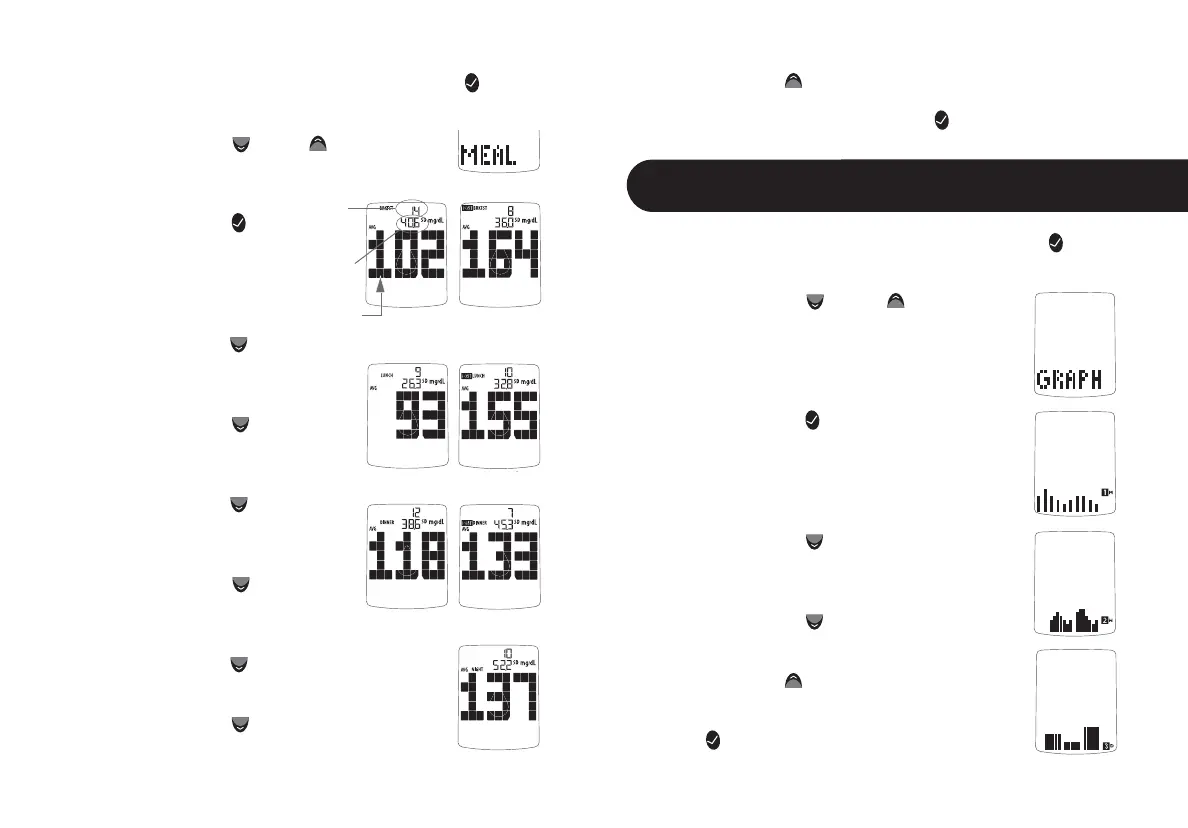
[1] When your meter is deactivated, press the CHECK ( ) button
once to enter menu mode. The word “MEM” is displayed.
[2] Press the DOWN (
) or UP ( ) arrow buttons
until the word “MEAL” appears in the lower part
of the display.
[3] Press the CHECK ( )
button again to enter the
mealtime averages section.
The display now shows your
breakfast average.
[4] Press the DOWN (
) arrow
button. The display now shows
your post breakfast average.
[5] Press the DOWN (
) arrow
button. The display now shows
your lunch average.
[6] Press the DOWN (
) arrow
button. The display now shows
your post lunch average.
[7] Press the DOWN (
) arrow
button. The display now shows
your dinner average.
[8] Press the DOWN (
) arrow button. The
display now shows your post dinner average.
[9] Press the DOWN (
) arrow button. The
display now shows your bedtime average.
[1] When your meter is deactivated, press the CHECK ( )
button once to enter menu mode. The word “MEM” is displayed.
Number
of results
tagged
Standard
Deviation
Average
Test Result
Note: Press the UP ( ) arrow button to scroll backwards. When
scrolling, you will cycle through the Pre/Post Mealtime Averages.
To return to the menu, press the CHECK (
) button.
Viewing 1 Month, 2 Week,
and 3 Day Trend Graphs
10.5