PRESSURE
HISTORY
30
53 54
55
B
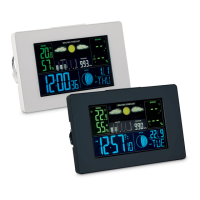
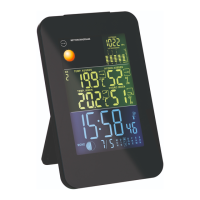
A = Horizontal version, B = Vertical version
53
History
54
Current air pressure
55
MAX and MIN icons
Current air pressure and air pressure
trend
The current air pressure is displayed in hPa in the
current air pressure area
54
. The value can be
manually changed (see chapter “Manual settings”).
The trend of the air pressure within the last 12 hours is
displayed in the form of a bar diagram in the history
area
53
. The scale goes from -1 (1 hour ago) to -12 (12
hours ago).
Maximum and minimum values
To display the highest and lowest values for the last 12
hours in relation to air pressure: