AZI Sales/Customer Service 800-528-7411 or 602-470-1414 or support@azic.com Page 22 of 26
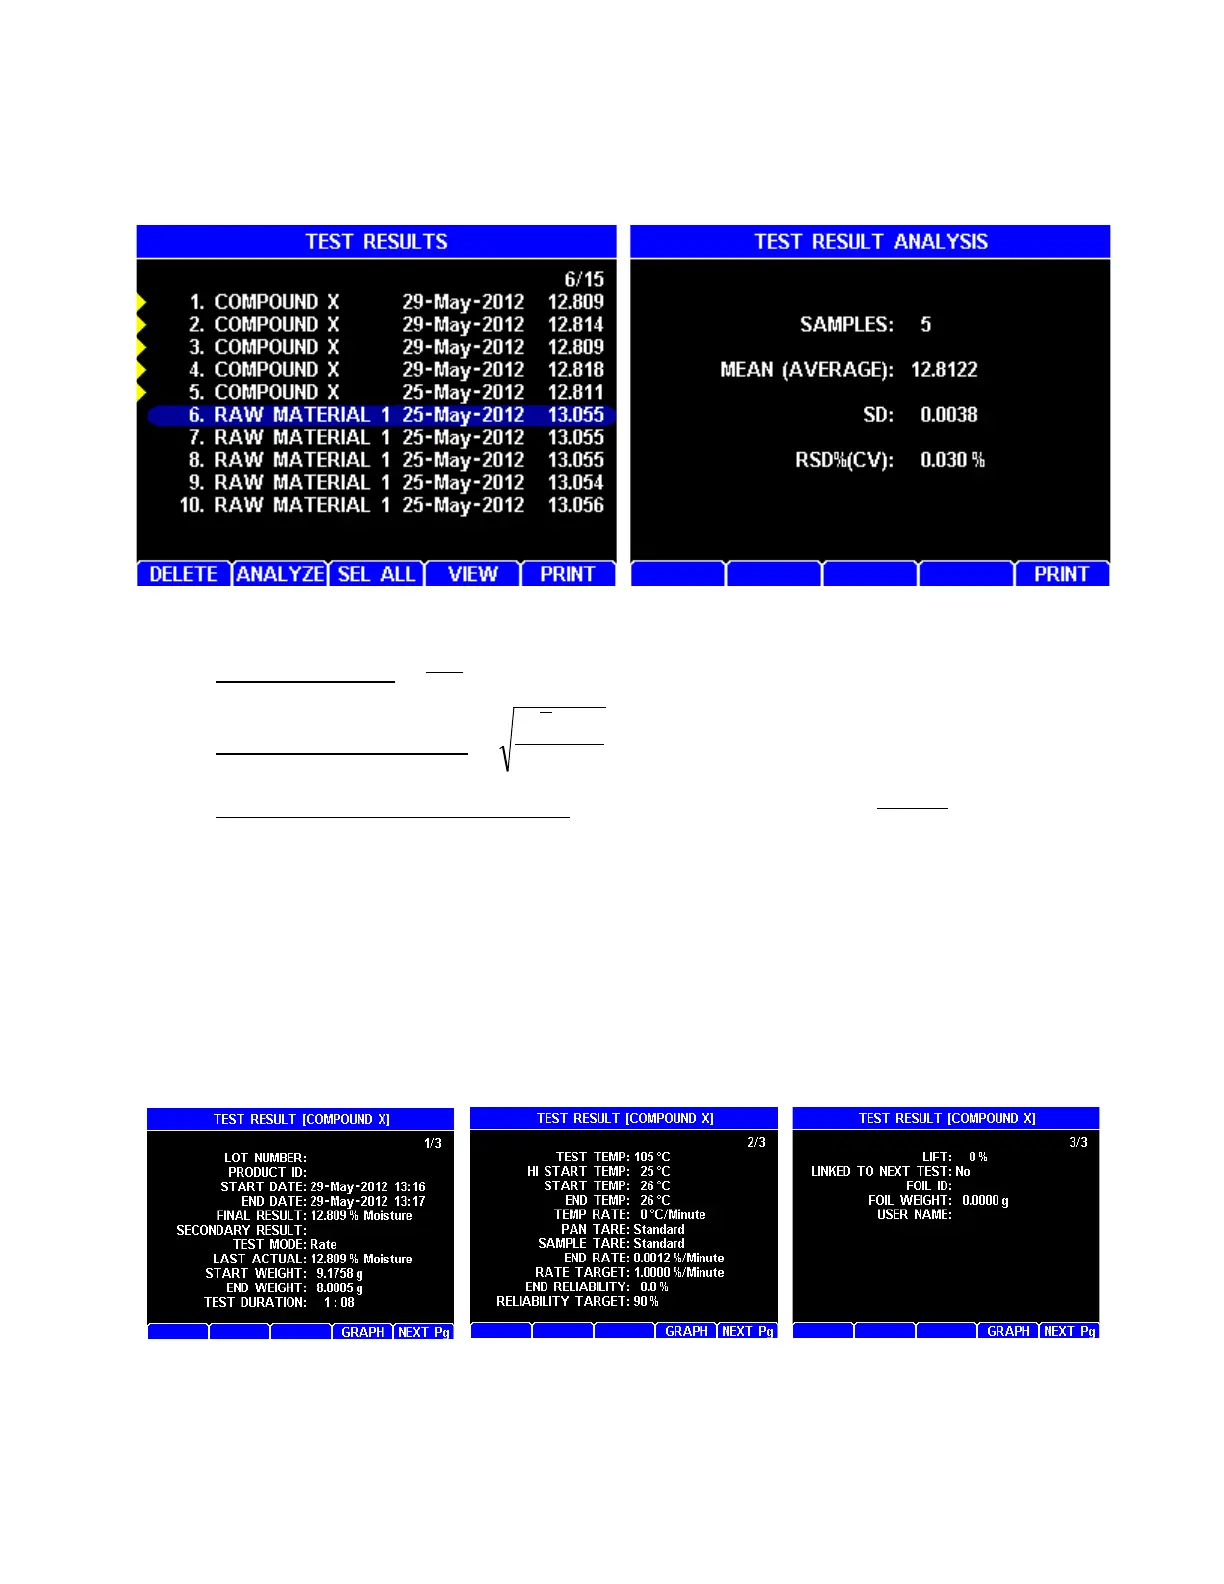
• [ANALYZE] – Compute the mean, standard deviation, and relative standard deviation
of the selected results. (The relative standard deviation is also known as the
coefficient of variation or CV.) The analysis can be printed with [PRINT].
The analysis is performed using the following formulas that are available on many
hand calculators:
o MEAN (average) =
o SD (standard deviation) =
o RSD (relative standard deviation) expressed as percentage =
• [SEL ALL] – Selects all of the Test Results stored in the instrument. The [DELETE],
[ANALYZE], and [PRINT] soft keys can then be used to delete, perform statistical
analysis on or print all of the Test Results.
• [VIEW] – View the test result that is highlighted by the cursor. There are 3 pages of
data for each test result. If there is a graph available for this test, then the [GRAPH]
soft key is displayed and can be used to view the graph. See section 6.2.1 Graph on
the next page for more information on graphs.
• [PRINT] - If no results are selected, then the result that is highlighted by the cursor is
printed. Otherwise, [PRINT] prints the selected results. Only report items that have
been selected in the REPORT ITEMS TO PRINT menu will print. See the manual for
details.
 Loading...