11
EN
B2B2B2
B2
B2 B2
B2
B1B1B1
B1
B1 B1
B1
S
S
S S
S
S
S
B2
B2
B1
B1
S
S
S
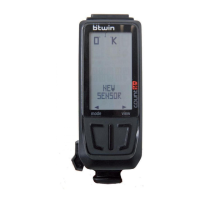
To switch from one menu to another use B1 and B2..
To enter a menu, press on S. Use B1 and B2 to navigate within the menu and press on S to conrm.
Menu explanations:
VIEW REPORT
Use this menu to view the reports from all the
sessions you have saved. They are sorted by session
date and time (time ashes), for example:
To see the details for each session, press on S. You can now see all available data:
- DISTANCE: the distance covered during the ride
- TIME: the time the ride lasted
- AVERAGE KpH: your average speed during the ride
- MAXKpH: your top speed during the ride
- AVERAGE RPM: your average cadence during the ride
- MAX RPM: your top cadence during the ride
- CADENCE IN TARGET: the time the cadence was in the cadence target zone (if target zone set)
- CADENCE %TARGET: the percentage of time the cadence was in the cadence target zone (if target zone set)
- AVERAGE BPM*: your average heart rate during the ride
- MAX BPM*: your top heart rate during the ride
- HR in TARGET*: the time the heart rate was in the heart rate target zone (if target zone set)
- HR % TARGET*: the percentage of time the heart rate was in the heart rate target zone (if target zone set)
- CALORIES*: the theoretical number of kilocalories you burned during the ride
*This data is only available if heart rate mode was enabled in the menu OPTION.
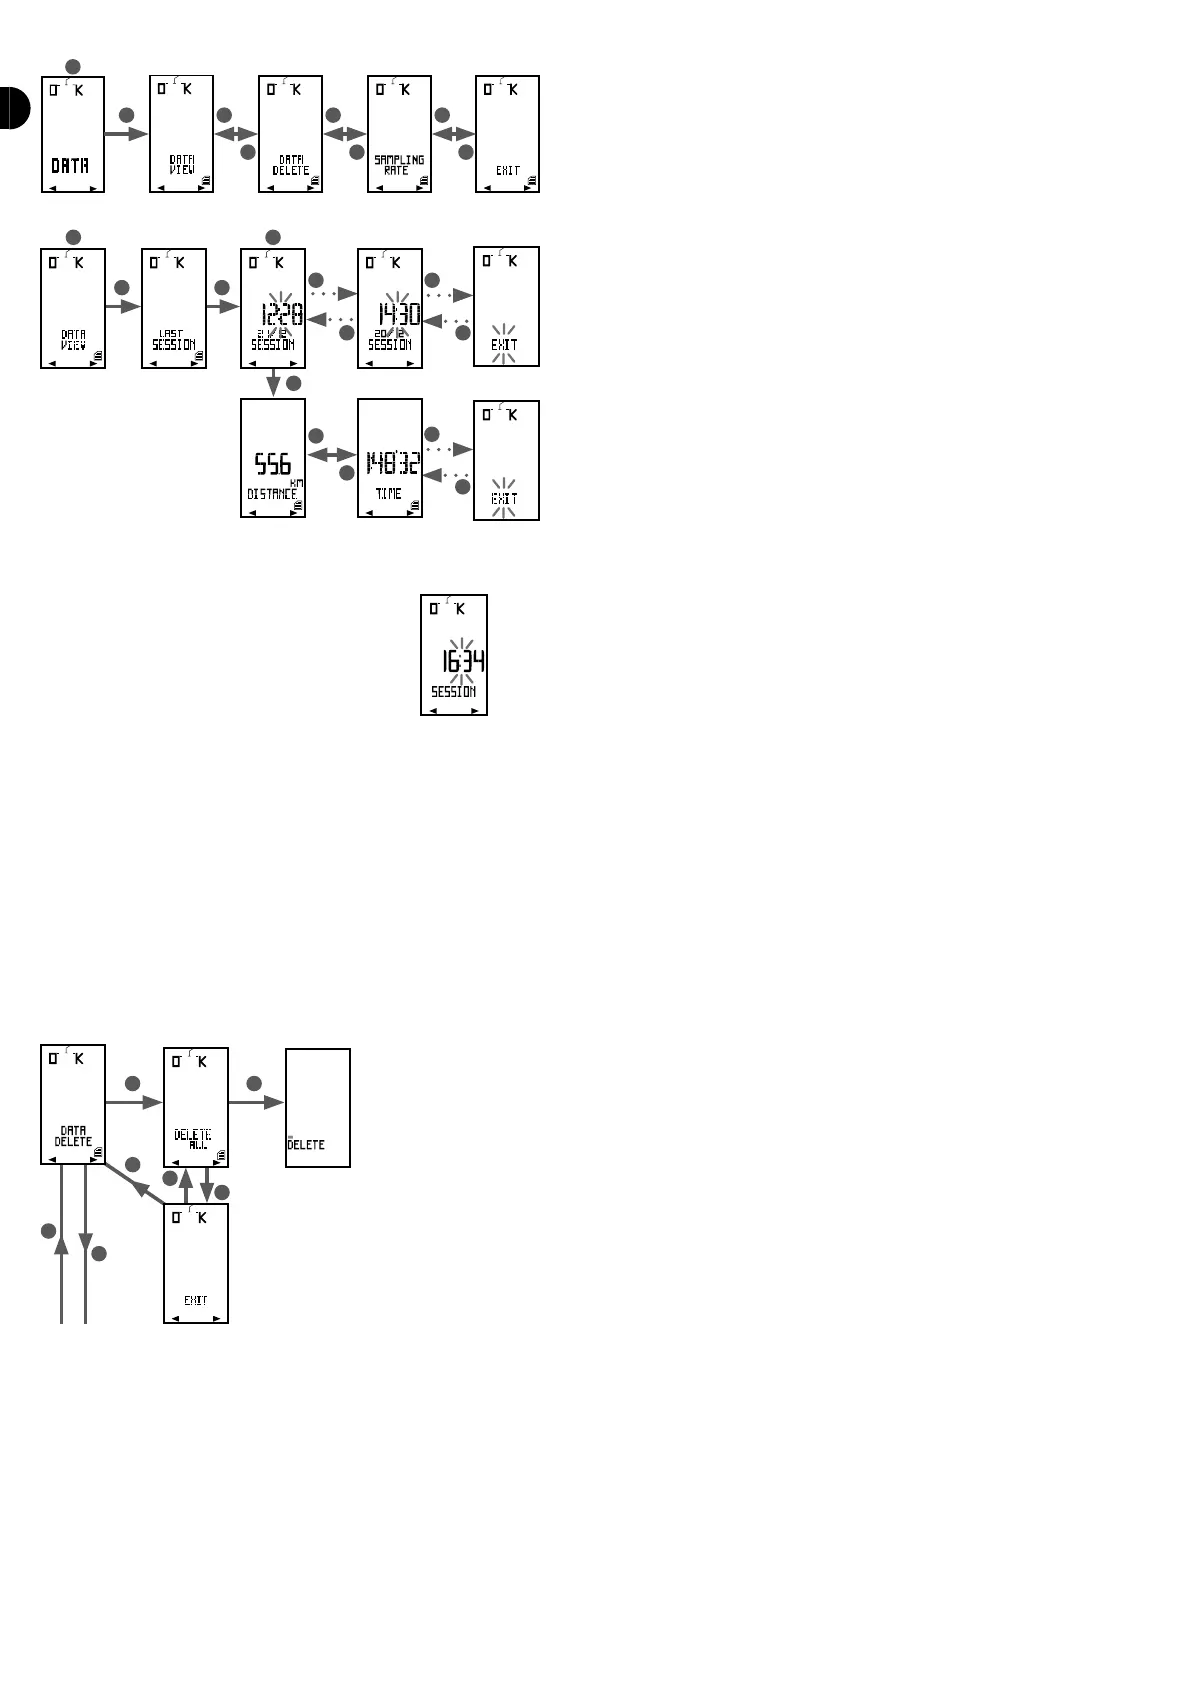
DELETE REPORT
In this menu, you can delete reports to free up memory.
Press on S to access the menu. The screen will display «DELETE ALL». Press on S to conrm or press on B1 or B2 to quit
the menu.
SAMPLE
To save all your ride data, the computer takes samples at certain intervals. These intervals will determine the accuracy of the charts on your PC, but also memory capacity.
The shorter the interval, the more accurate the charts, but the shorter the memory. Conversely, the longer the interval the greater the memory capacity, however the
charts will be less accurate.
You may set this interval in the SAMPLE menu. You can choose between 3 intervals:
- 2 seconds: 6 hours of memory
- 5 seconds: 15 hours of memory
- 10 seconds: 30 hours of memory