Instruction Manual for LA4 with 1.0.X Firmware – REV A Page 34
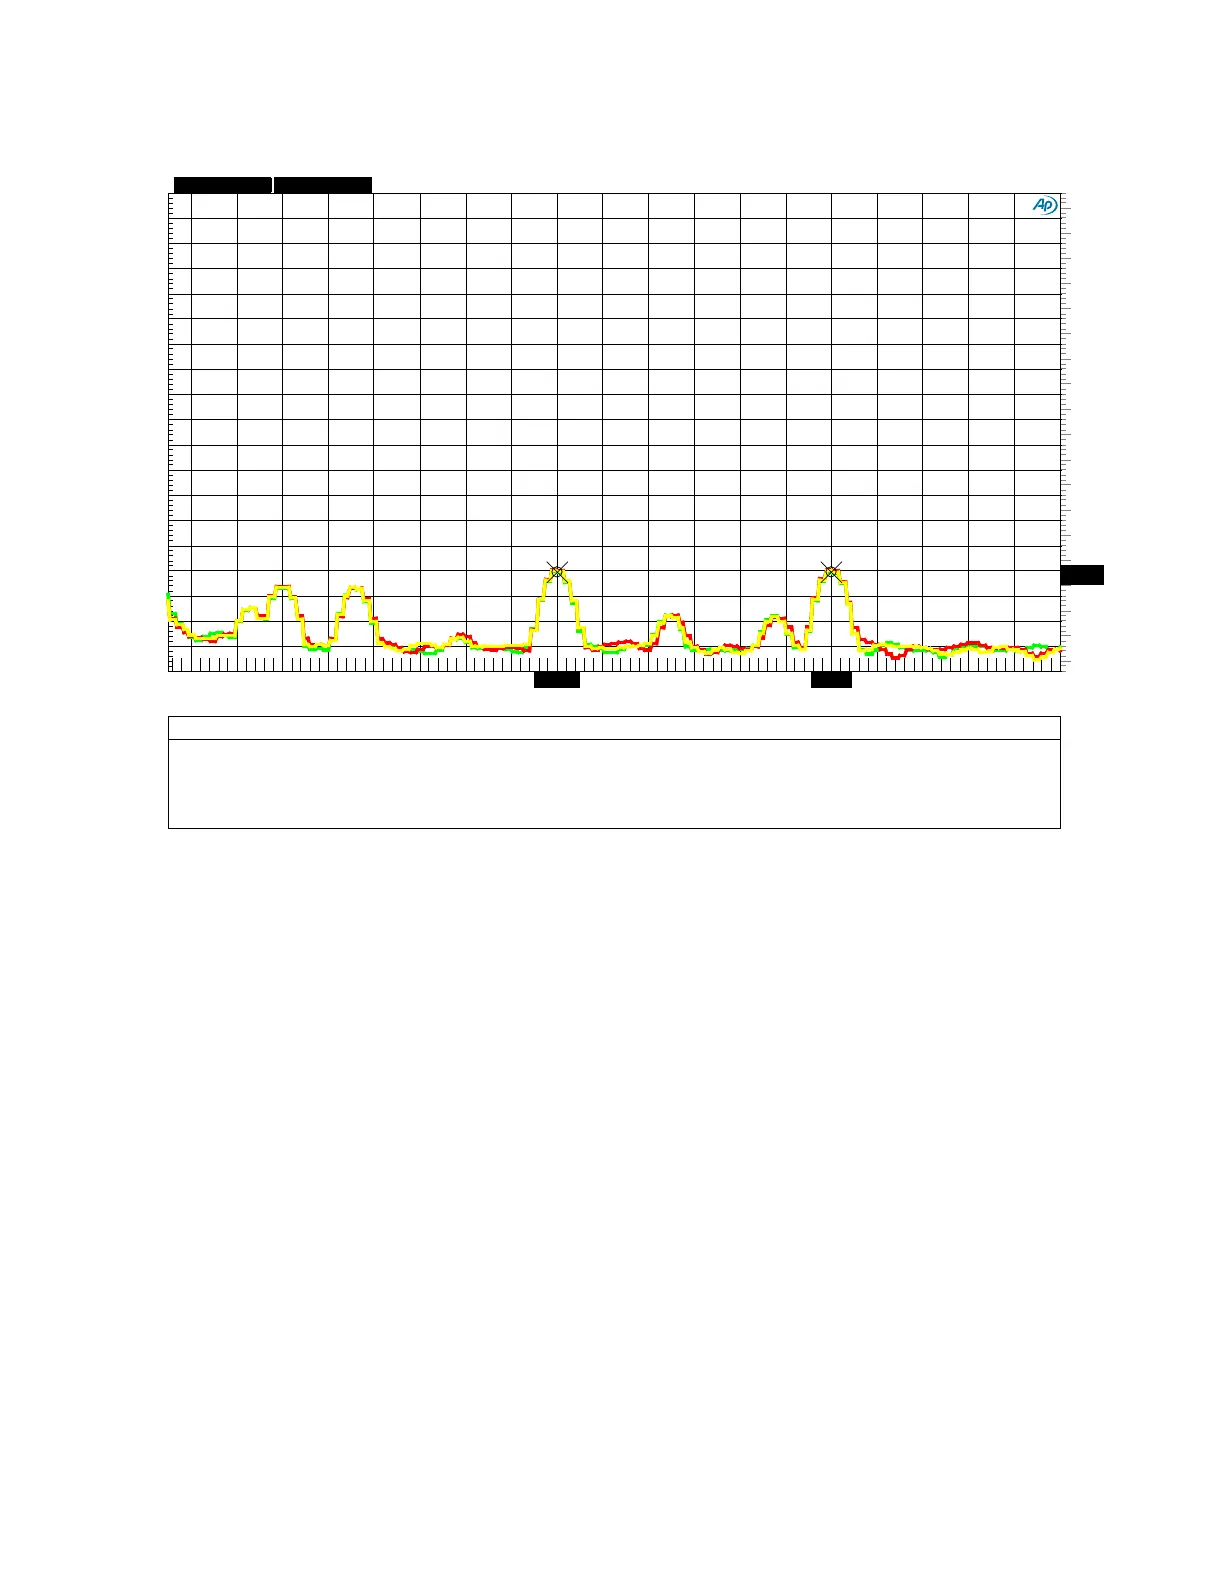
Graph 6 - AC Line-Related Hum - Line Amplifier
This FFT plot shows that AC line-related hum is 150 dB below the maximum output level of +28
dBu (use the left-hand dBr A scale)! The AC line frequency was 60 Hz in this test.
This plot also shows that AC line-related hum is 144 dB below the maximum input level of an
AHB2 power amplifier. These levels are so low that they will not impact the system SNR through
an external AHB2.
Notes:
• The scale on the left (dBr A) is dB relative to +28 dBu. This is the maximum input and
output level supported by the LA4 line stage.
• The scale on the right (dBr B) is dB relative to +22 dBu. This is the input level required to
drive an external AHB2 power amplifier to full output power.
• Balanced inputs to balanced line outputs, volume control set at 0 dB.
FFT_Idle_Unity_Gain_Bal_Bal_Low_Freq.at27
ColorSweep
Trace Line Style
Thick Data Axis
Comment Source 2
Cursor1 Cursor2
1 2
Green Solid
4 Fft.Ch.1 Ampl Left
Left Line Out : 1.00000 =Swr.Ch. A Input
-150.645 dBr A -150.464 dBr A
1
3
Green Solid 4 Fft.Ch.1 Ampl Right
: 1.00000 =Swr.Ch. A Input *-144.645 dBr
*-144.464 dBr
2 2 Red Solid 4
Fft.Ch.1 Ampl Left Right Line Out : 2.00000 =Swr.Ch. A Input -149.889 dBr A
-149.685 dBr A
2
3
Red Solid
4
Fft.Ch.1 Ampl Right
: 2.00000 =Swr.Ch. A Input -143.889 dBr B -143.685 dBr B
3
2 Yellow Solid
4 Fft.Ch.1 Ampl
Left Mono Line Out
: 3.00000 =Swr.Ch. A Input -150.113 dBr A -150.050 dBr A
3 3 Yellow
Solid 4 Fft.Ch.1 Ampl Right
: 3.00000 =Swr.Ch. A Input -144.113 dBr B
-144.050 dBr B
-180
+0
-170
-160
-150
-140
-130
-120
-110
-100
-90
-80
-70
-60
-50
-40
-30
-20
-10
-190
+0
-180
-170
-160
-150
-140
-130
-120
-110
-100
-90
-80
-70
-60
-50
-40
-30
-20
-10
20 400 40 60 80 100 120 140 160 180 200 220
240
260
280
300 320 340 360 380
180.196 300.02