36 Conventional Fire Panels J424/J408
TEMPERATURE (°C) -10-5 0 5 10152025303540 4550
VOLTAGE (V) 29.0 28.8 28.6 28.2 28.0 27.8 27.4 27.2 27.0 26.8 26.6 26.4 26.2
Table 3 Switching Power Supply Output Voltage chart. To find the Output Voltage using the chart: — select the nea
-
rest value to the Probe temperature on the TEMPERATURE (°C) row; read the respective value on the VOLTAGE (V)
row; adjust the Output Voltage of the Switching Power Supply to the indicated value. For example, if the Probe tempe
-
rature is 22 °C, the Output Voltage of the Switching Power Supply must be set at 27.4 V.
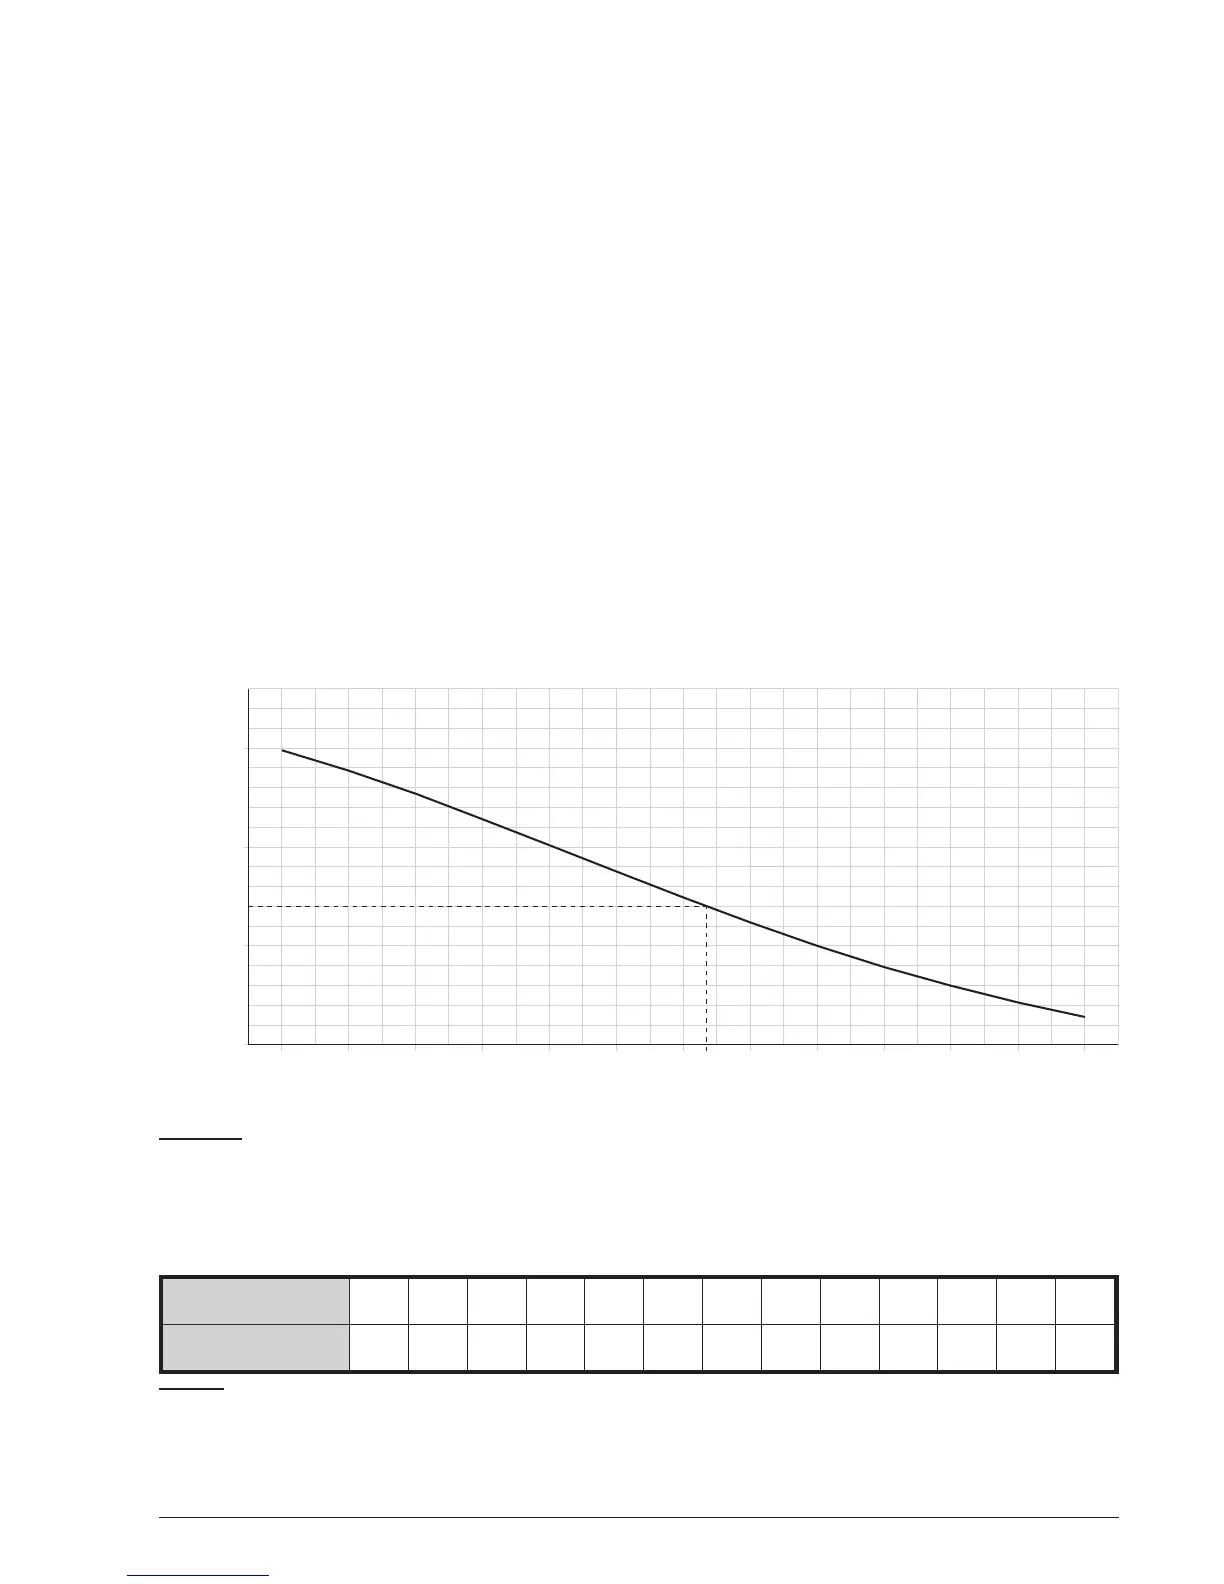
-10-5 0 5 101520253035404550
26,0
27,0
28,0
29,0
a)
27,4
22
Figure 22 Switching Power Supply Output Voltage graph. To find the Output Voltage using the graph: — indicate the
Probe temperature on the TEMPERATURE (°C) axis; draw a line from the temperature value point up to the curve a);
draw a line from the intersection point across to the VOLTAGE (V) axis; adjust the Output Voltage of the Switching Po
-
wer Supply to the resultant value. For example, if the Probe temperature is 22 °C, the Output Voltage of the Switching
Power Supply must be set at 27.4 V.
 Loading...