7
7. Evaluation of results
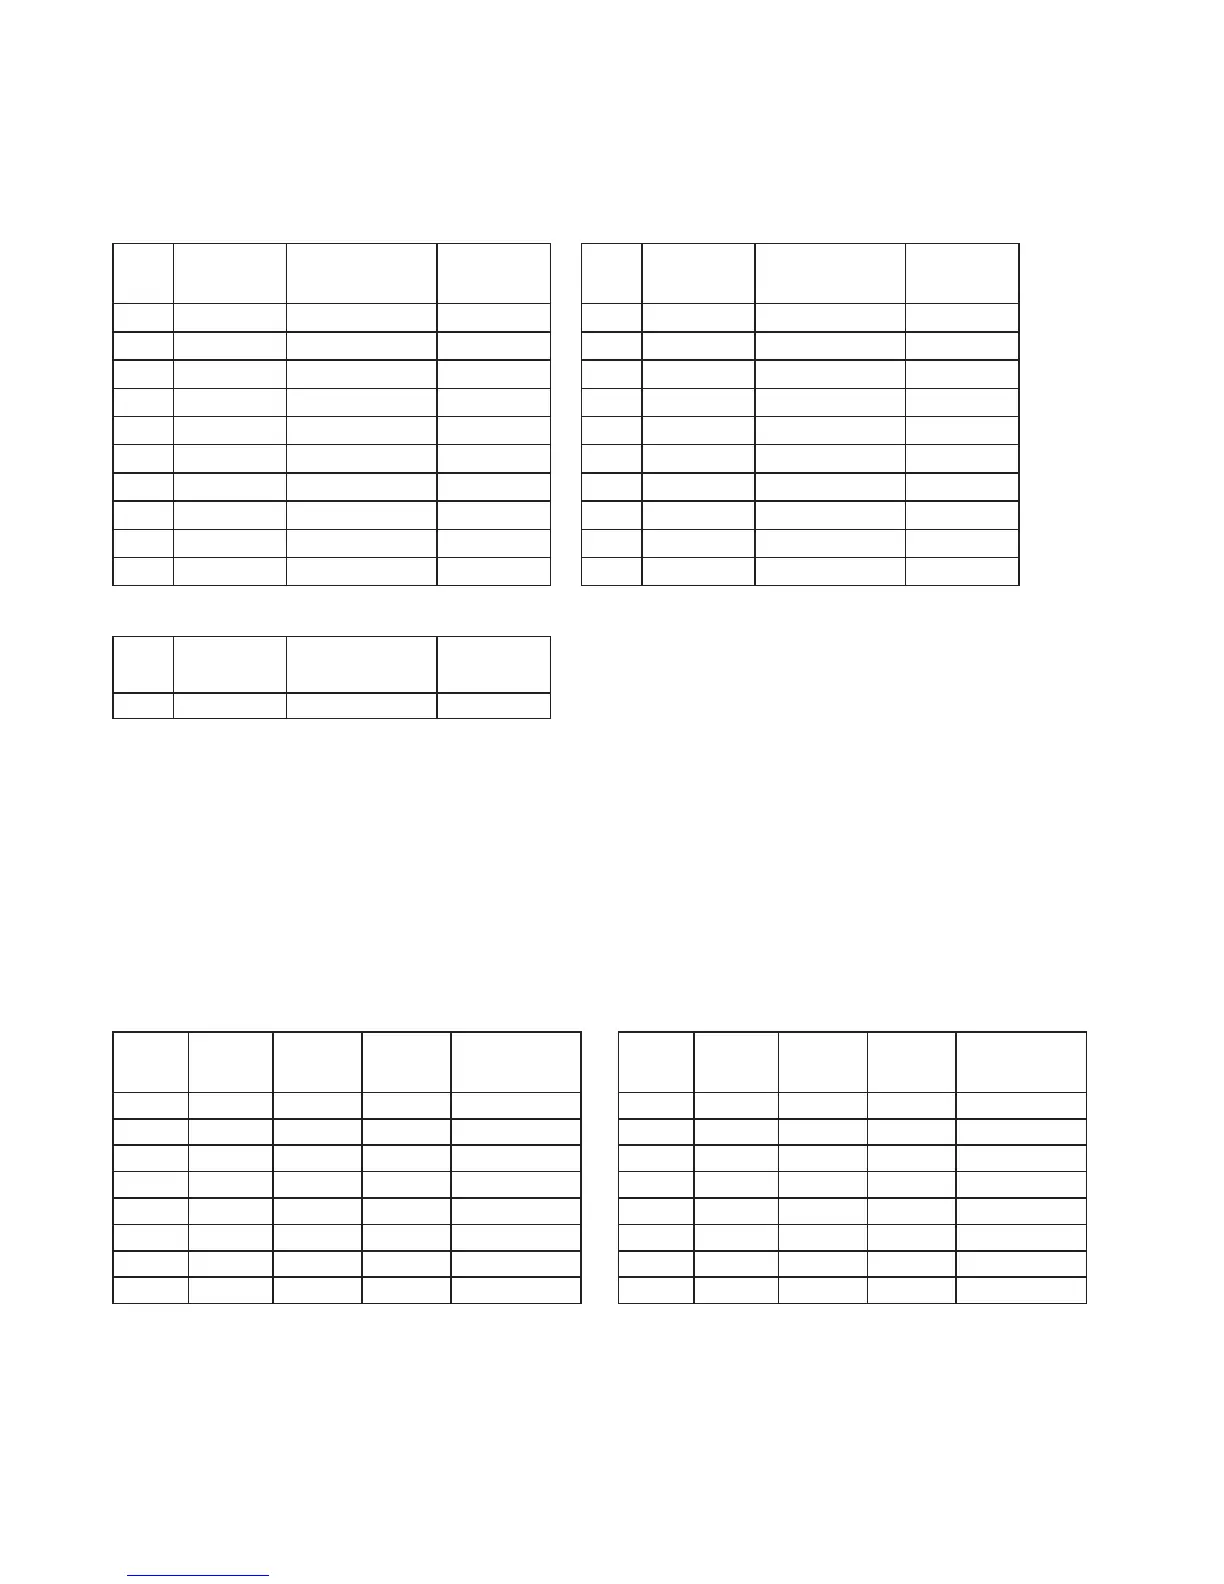
Body weight / Body mass index
The Body Mass Index (BMI) is a number often used to evaluate body composition. The number is calculated from
body weight and height, the formula is “BMI = body weight : height
2
. The measurement unit for BMI is [kg/m
2
].
Men < 20 years Women < 20 years
Age Under
-
weight
Normal
weight
Over
-
weight
Age Under
-
weight
Normal
weight
Over
-
weight
10 12.7 – 14.8 14.9 –18.4 18.5 – 26.1 10 12.7 – 14.7 14.8 –18.9 19.0 – 28.4
11 13.0 – 15.2 15.3 –19.1 19.2 – 28.0 11 13.0 – 15.2 15.3 –19.8 19.9 – 30.2
12 13.3 – 15.7 15.8 –19.8 19.9 – 30.0 12 13.3 – 15.9 16.0 – 20.7 20.8 – 31.9
13 13.7 – 16.3 16.4 – 20.7 20.8 – 31.7 13 13.7 – 16.5 16.6 – 21.7 21.8 – 33.4
14 14.2 – 16.9 17.0 – 21.7 21.8 – 33.1 14 14.2 – 17.1 17.2 – 22.6 22.7 – 34.7
15 14.6 – 17.5 17.6 – 22.6 22.7 – 34.1 15 14.6 – 17.7 17.8 – 23.4 23.5 – 35.5
16 15.0 – 18.1 18.2 – 23.4 23.5 – 34.8 16 15.0 – 18.1 18.2 – 24.0 24.1 – 36.1
17 15.3 – 18.7 18.8 – 24.2 24.3 – 35.2 17 15.3 – 18.3 18.4 – 24.4 24.5 – 36.3
18 15.6 – 19.1 19.2 – 24.8 24.9 – 35.4 18 15.6 – 18.5 18.6 – 24.7 24.8 – 36.3
19 15.8 – 19.5 19.6 – 25.3 25.4 – 35.5 19 15.8 – 18.6 18.7 – 24.9 25.0 – 36.2
Men / Women ≥ 20 years
Age Under
-
weight
Normal
weight
Over
-
weight
≥ 20 15.9 – 18.4 18.5 – 24.9 25.0 – 40.0
Source: Bulletin of the World Health Organization 2007;85:660-7; Adapted from WHO 1995, WHO 2000 and WHO 2004.
Note that with very muscular physiques such as bodybuilders, the BMI result will indicate overweight since no
account is taken for well above average muscle mass.
Body fat
The following body fat percentages are guide values (contact your physician for further information).
A lower value is often found in athletes. Depending on the type of sports, training intensity and physical con
-
stitution, values may result which are below the recommended values stated. It should, however, be noted that
there could be a danger to health in the case of extremely low values.
Men Women
Age
very
good
good average poor Age
very
good
good average poor
10 -14 <11 % 11-16 % 16.1- 21 % >21.1 % 10-14 <16 % 16 - 21 % 21.1- 26 % >26.1 %
15 -19 <12 % 12 -17 % 17.1- 22 % >22.1 % 15-19 <17 % 17- 22 % 22.1- 27 % >27.1 %
20 - 29 <13 % 13 -18 % 18.1- 23 % >23.1 % 20-29 <18 % 18 - 23 % 23.1- 28 % >28.1 %
30 - 39 <14 % 14 -19 % 19.1- 24 % >24.1 % 30-39 <19 % 19 - 24 % 24.1- 29 % >29.1 %
40 - 49 <15 % 15 - 20 % 20.1- 25 % >25.1 % 40-49 <20 % 20 - 25 % 25.1- 30 % >30.1 %
50 - 59 <16 % 16 - 21 % 21.1- 26 % >26.1 % 50-59 <21 % 21- 26 % 26.1- 31 % >31.1 %
60 - 69 <17 % 17- 22 % 22.1- 27 % >27.1 % 60-69 <22 % 22 - 27 % 27.1- 32 % >32.1 %
70 -100 <18 % 18 - 23 % 23.1- 28 % >28.1 % 70-100 <23 % 23 - 28 % 28.1- 33 % >33.1 %
Body water
According to the World Health Organization (WHO 2001), the percentage of body water should normally lie
within the following ranges:
Women: 50 – 55 %
Men: 60 – 65 %
Children: 65 –75 %
 Loading...