33
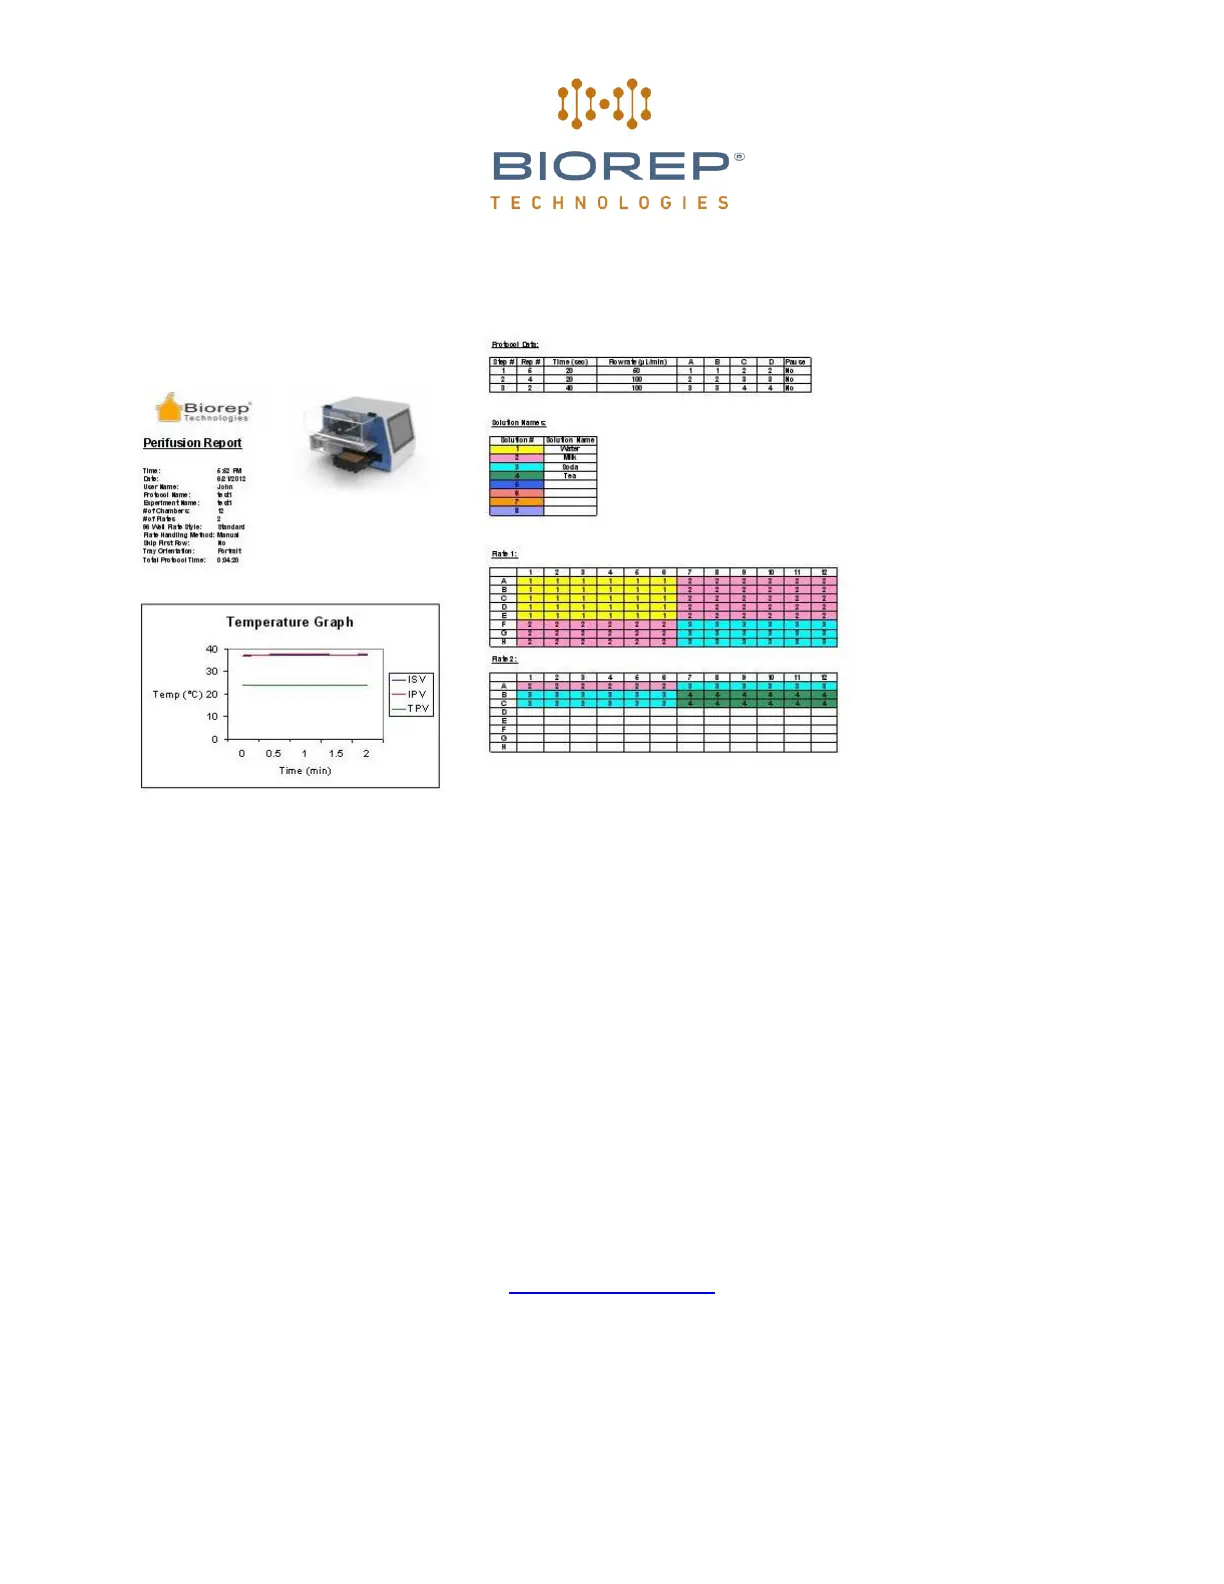
Figure 45: Sample report
An experiment report will be automatically generated. The report includes user and sample information, and
protocol specific information, such as the temperature profiles, the solutions used, and the timing of the
experiment. The most useful section of the report is the Well-Plate maps, color coded according to the solution
used. The plate maps are in tabular form, representing the 96 well plate (8 x 12), and each cell represents an
individual well. Each cell contains two pieces of information. The color indicates which solution was used, and the
number indicates the STEP. This map is useful when cross-referencing the data to subsequent processing such
as ELISA.
10 Customer Service
If you encounter any problems, please contact customer support at:
Biorep Technologies, Inc.
15804 NW 57
th
Ave
Miami Lakes, FL 33014
info@biorep.com
www.biorep.com
Tel: 305-330-4449
Fax: 305-330-4402
 Loading...