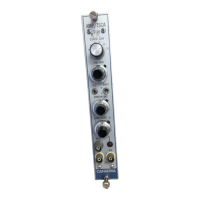
Figure 6 shows the correct setting of the pole/zero control, with Figures 7 and 8 show
-
ing under and over compensation, respectively for the preamplifier decay time con
-
stant. Notice some small amplitude signals with long decay times in Figure 6. These
are due to charge trapping in the detector and cannot be corrected by the pole/zero
control.
9
Spectroscopy System Operation
Figure 6 Correct Pole/Zero Compensation
Figure 7 Undercompensated Pole/Zero
Scope
Vertical: 50 mV/cm
Horizontal: 10µs/cm
Source
60
Co
1.33 MeV peak: 9 V amplitude
Count rate: ≈ 3kcps
Shaping: 2 µs
Figure 8 Overcompensated Pole/Zero