20050501
u [Graph] - [Column Series]
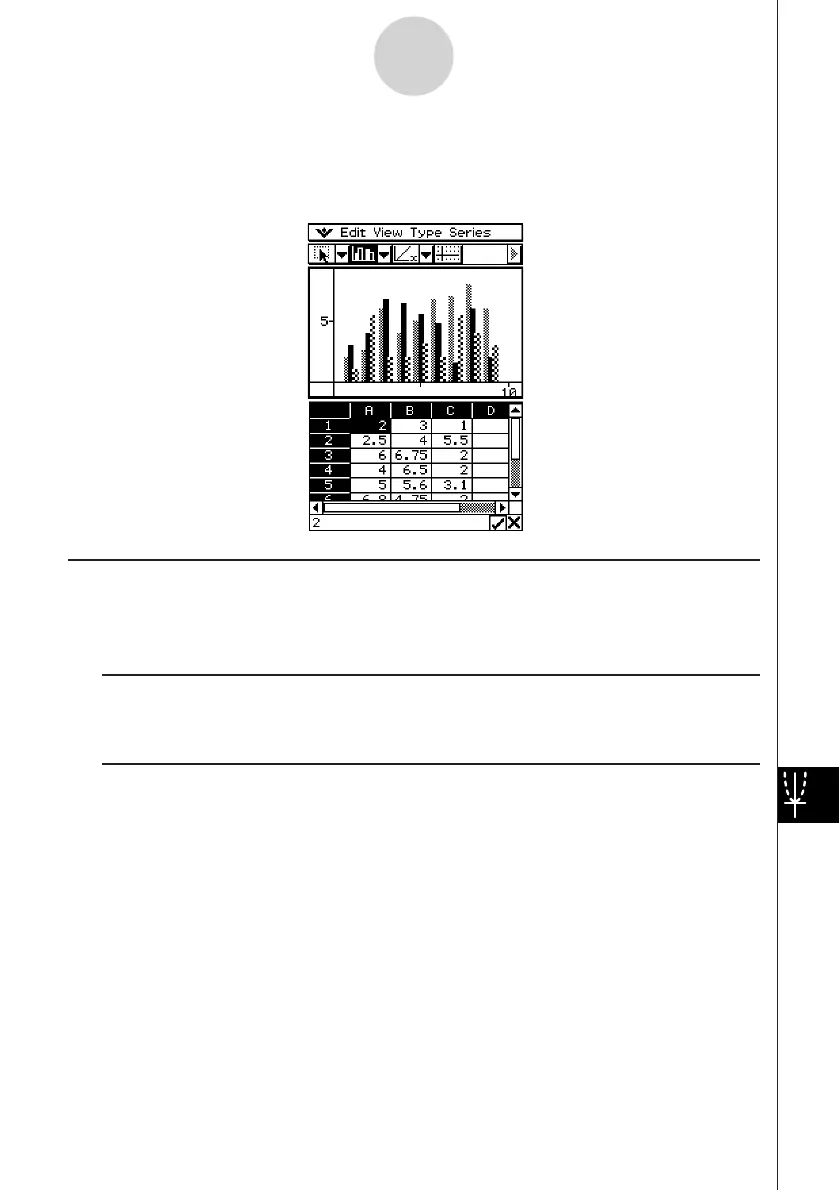
Selecting this option treats each column as a separate set of data. The value in each row is
plotted as a vertical axis value. The following shows a typical clustered column graph while
[Column Series] is selected, and the data that produced it.
Graph Window Menus and Toolbar
The following describes the special menus and toolbar that appears whenever the
Spreadsheet application Graph window is on the display.
k O Menu
•See “Using the O Menu” on page 1-5-4.
k Edit Menu
•See “Edit Menu” on page 13-2-1.
13-8-8
Graphing