20050501
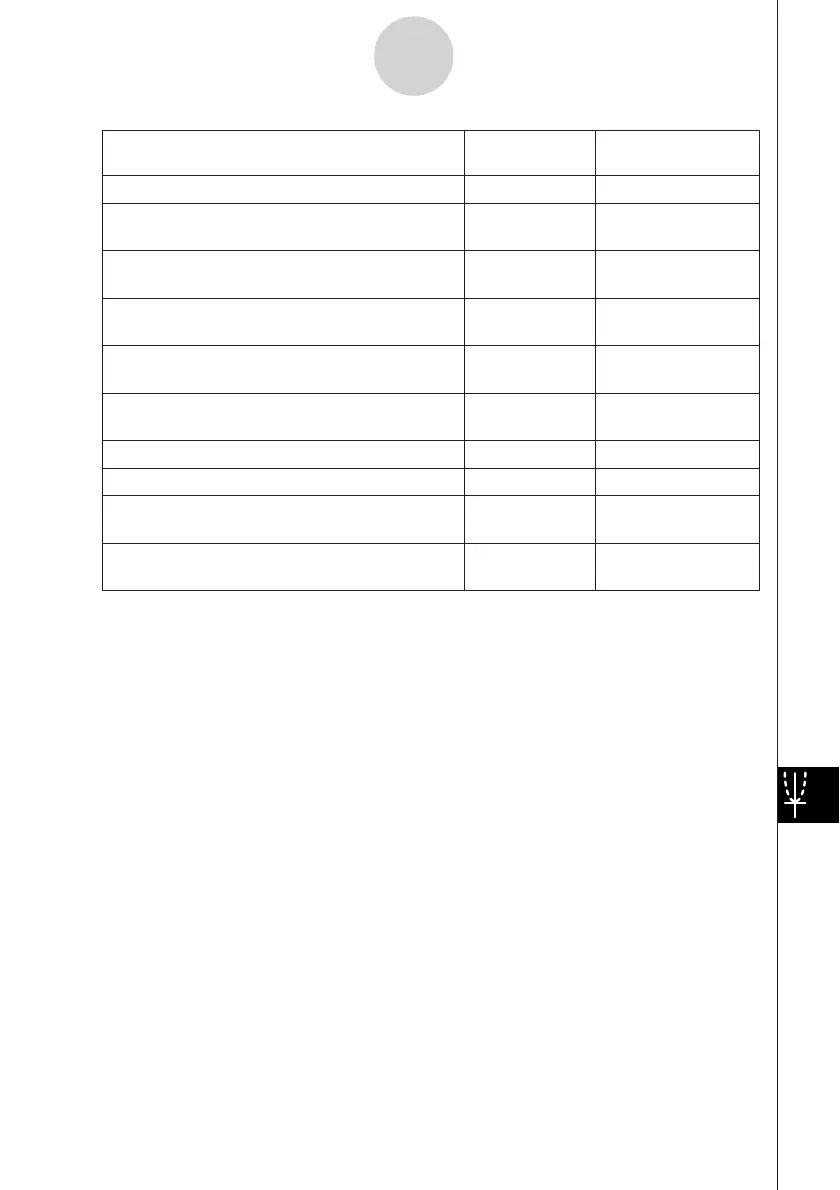
To do this:
Tap this Or select this
toolbar button: [Series] menu item:
Display a linear regression curve d Trend - Linear
Display a quadratic regression curve f
Trend - Polynomial -
Quadratic
Display a cubic regression curve g
Trend - Polynomial -
Cubic
Display a quartic regression curve h
Trend - Polynomial -
Quartic
Display a quintic regression curve j
Trend - Polynomial -
Quintic
Display an exponential Ae
B
x
regression curve k Trend - Exponential
Display a logarithmic Aln(x) + B regression curve l Trend - Logarithmic
Display a power Ax
B
regression curve ; Trend - Power
Convert the data of the selected column to a
z Line
line graph
Convert the data of the selected line to a column
' Column
graph
Important!
•Exponential and logarithmic regression curves ignore negative values when calculating the
curve. A message appears in the status bar to let you know when negative values are
ignored.
13-8-10
Graphing