20050501
u To display a regression curve
(1) Draw a clustered line graph or clustered column graph.
•A regression curve can be drawn for a line, column, or scatter graph only.
• The above shows a stacked line graph.
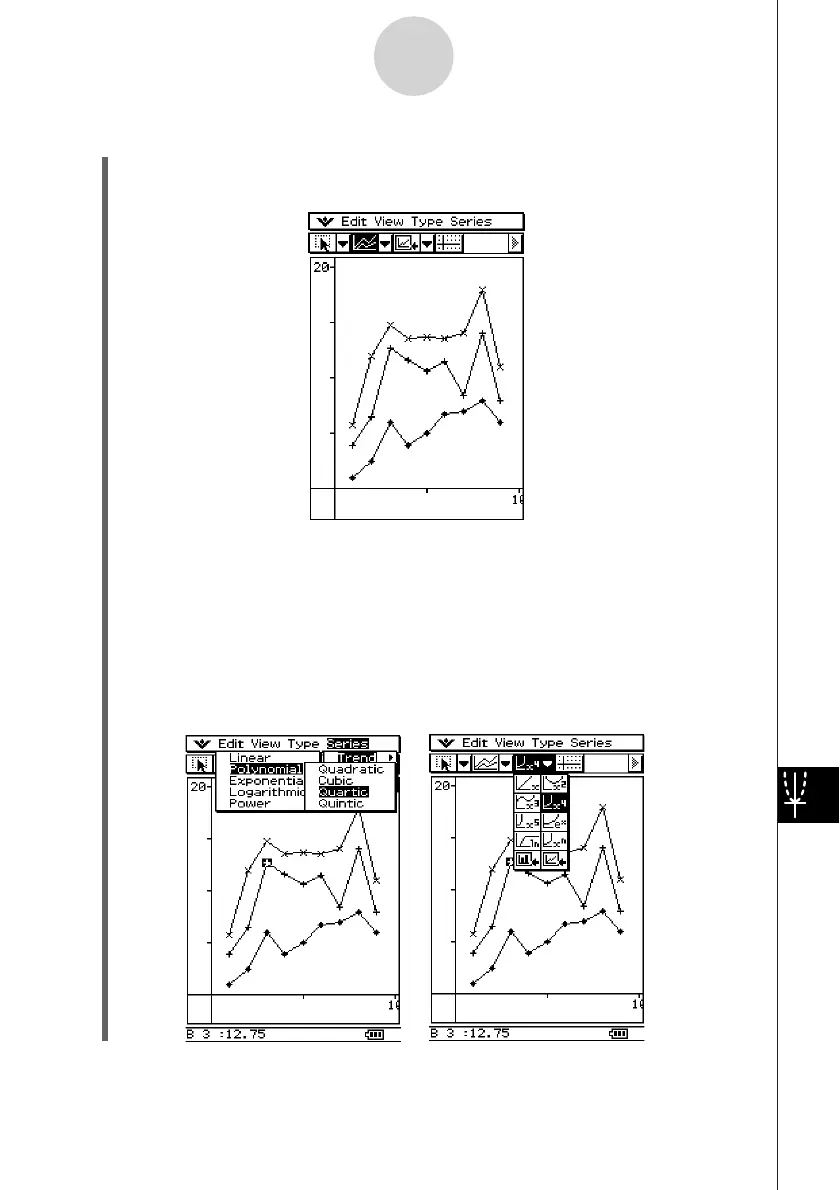
(2) With the stylus, tap any point of the data for which you want to draw the regression
curve.
(3) Use the [Series] menu to select the type of regression curve you want.
•You could also tap the down arrow button next to the third tool button from the left,
and tap an icon to select the regression curve type.
•See “Series Menu” on page 13-8-9 for information about regression curve types.
•Here, we will select quartic regression.
13-8-16
Graphing