20050501
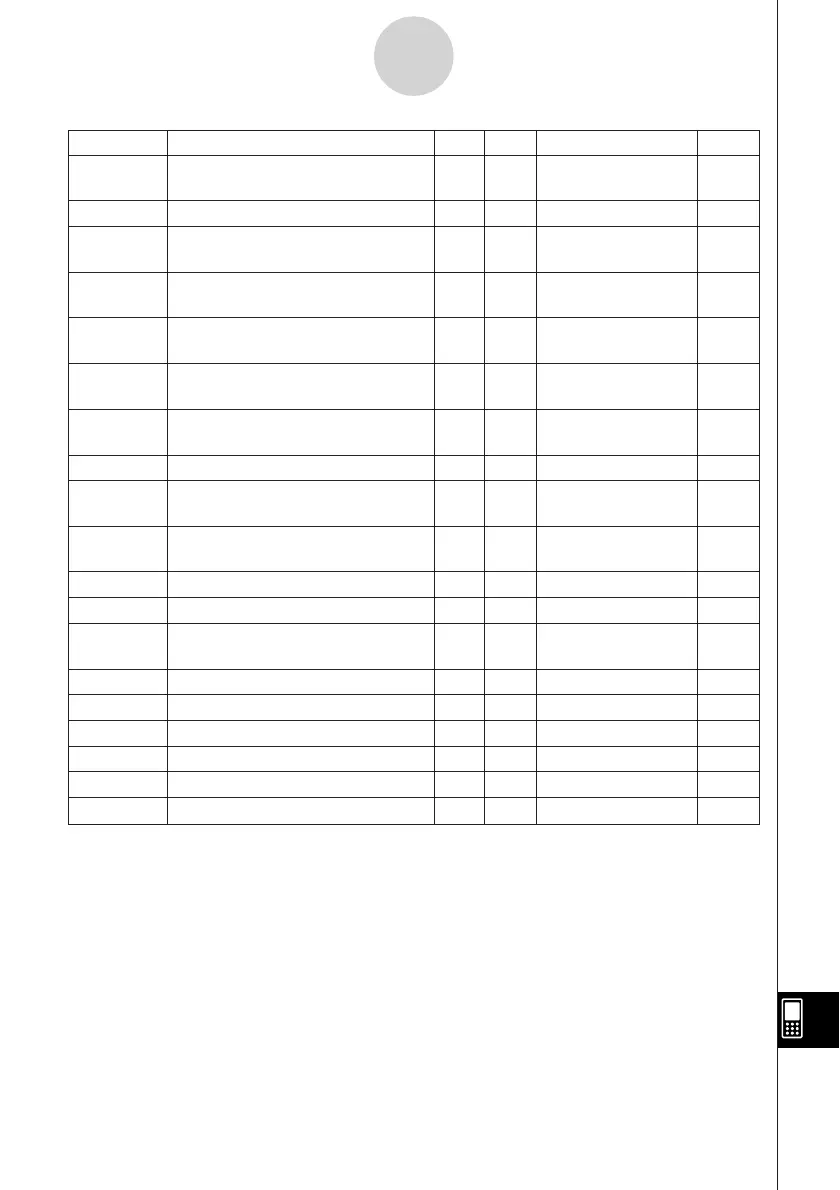
Name Description Input Delete Data Type Default
3D Graph View Window Display
ymin3D
Range y-axis Minimum Value
䊊 – EXPR (Real Number) –3
yscl View Window Display Range YScale 䊊 – EXPR (Real Number) 1
yt1(t)~ Graph Expression Input Variable, 䊊
䊊 FUNC
yt100(t) Param Type (Define)
yσn
Population Standard Deviation of y
––EXPR (Real Number)
(Statistics Calculation)
yσn–1
Sample Standard Deviation of y
––EXPR (Real Number)
(Statistics Calculation)
z1(x,y)~
3D Graph Function Expression
䊊
䊊 FUNC
z100(x,y) (Define)
zc
Graph Coordinate Value Storage
––EXPR (Real Number) 0
Variable
zLower Result of NormCD Calculation – – EXPR (Real Number)
3D Graph View Window Display
zmax3D
Range z-axis Maximum Value
䊊 – EXPR (Real Number) 3
3D Graph View Window Display
zmin3D
Range z-axis Minimum Value
䊊 – EXPR (Real Number) –3
zUpper Result of NormCD Calculation – – EXPR (Real Number)
Zvalue z Value – – EXPR (Real Number)
θc
Graph Coordinate Value Storage
––EXPR (Real Number) 0
Variable
∑x Sum of x (Statistics Calculation) – – EXPR (Real Number)
∑x
2
Sum of x
2
(Statistics Calculation) – – EXPR (Real Number)
∑xy Sum of xy Data (Statistics Calculation) – – EXPR (Real Number)
∑y Sum of y (Statistics Calculation) – – EXPR (Real Number)
∑y
2
Sum of y
2
––EXPR (Real Number)
χ
2
value χ
2
Value – – EXPR (Real Number)
α
-7-7
System Variable Table