• SOLVE uses Newton’s method, so even if there are multiple solutions,
only one of them will be returned.
• Due to limitations in Newton’s method, solutions tend to be difficult to
obtain for equations like the following:
y
= sin x, 𝑦 = 𝑒
𝑥
, 𝑦= 𝑥.
Statistical Calculations
Perform the steps below to start a statistical calculation.
1. Press , select the Statistics Mode icon, and then press .
2. On the Select Type screen that appears, select a statistical calculation
type.
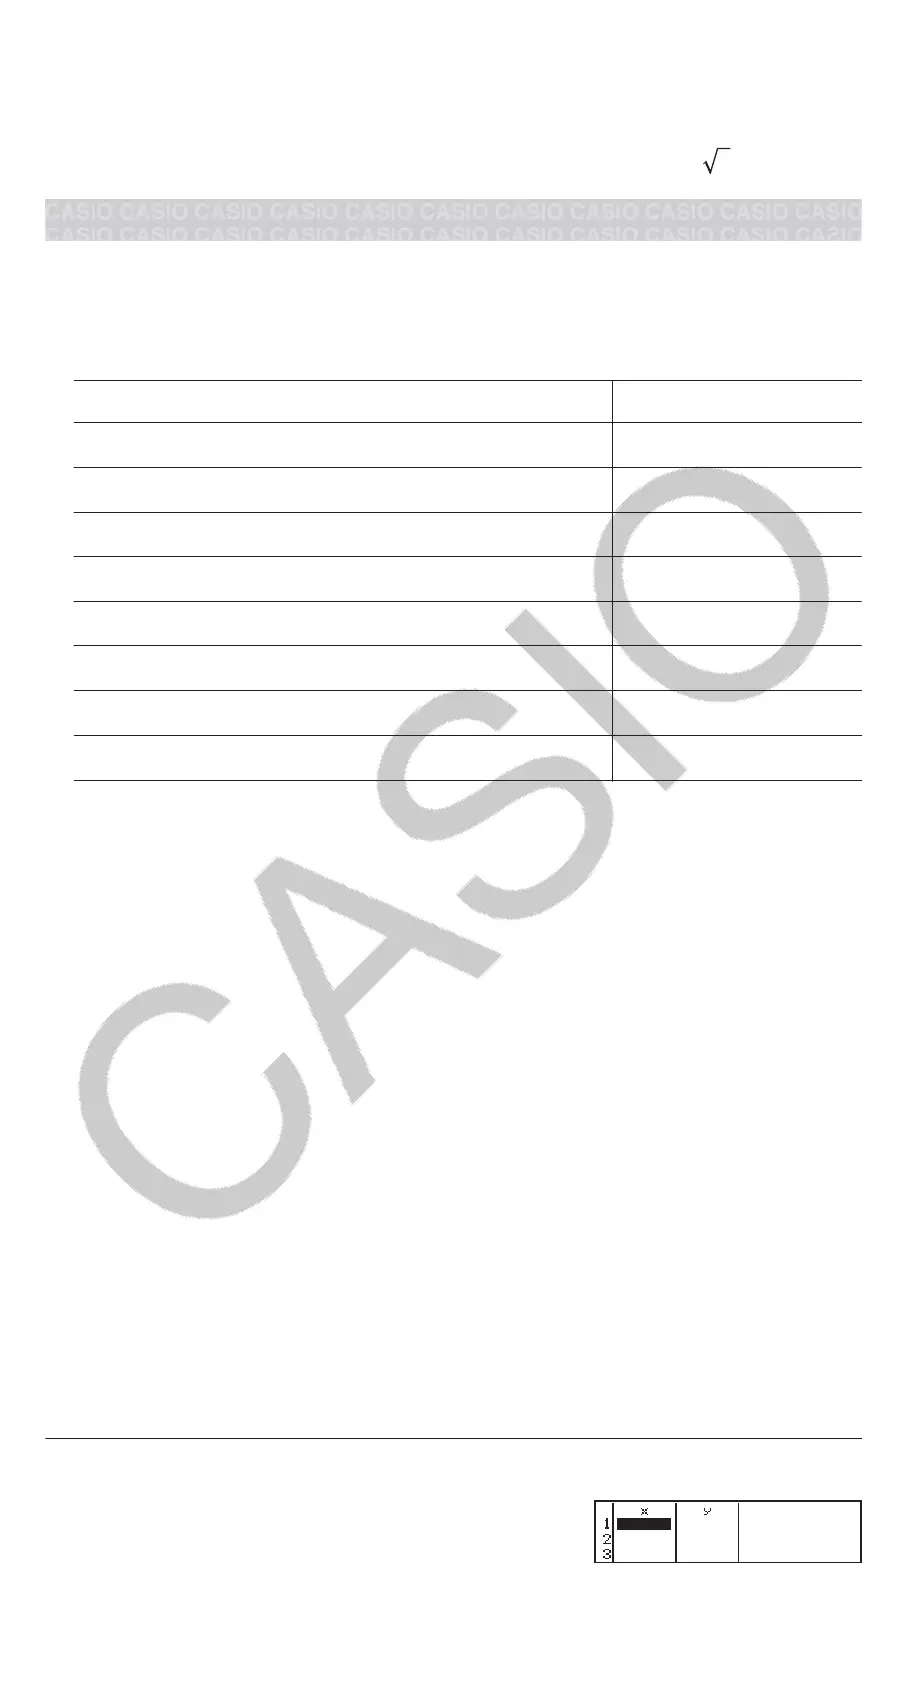
To select this type of statistical calculation: Press this key:
Single-variable (x)
(1-Variable)
Paired-variable (x, y), linear regression
(y=a+bx)
Paired-variable (x, y), quadratic regression
(y=a+bx+cx
2
)
Paired-variable (x, y), logarithmic regression
(y=a+b・ln(x))
Paired-variable (x, y), e exponential regression
(y=a・e^(bx))
Paired-variable (x, y), ab exponential regression
(y=a・b^x)
Paired-variable (x, y), power regression
(y=a・x^b)
Paired-variable (x, y), inverse regression
(y=a+b/x)
• Performing any of the above key operations displays the Statistics
Editor.
Note: When you want to change the calculation type after entering the
Statistics Mode, perform the key operation (Select Type) to display
the calculation type selection screen.
Inputting Data with Statistics Editor
Statistics Editor displays one, two, or three columns: single-variable (x),
single variable and frequency (x, Freq), paired-variable (x, y), paired-
variable and frequency (x, y, Freq). The number of data rows that can be
input depends on the number of columns: 160 rows for one column, 80
rows for two columns, 53 rows for three columns.
Note
• Use the Freq (frequency) column to input the quantity (frequency) of
identical data items. Display of the Freq column can be turned on
(displayed) or off (not displayed) using the Statistics setting on the setup
menu.
• Pressing the key while the Statistics Editor is on the screen will
display a statistical calculation screen for performing calculations based
on the input data. What you need to do to return to the Statistics Editor
from the statistical calculation screen depends on the calculation type
you selected. Press (Data) if you selected single-variable or
(Data) if you selected paired-variable.
Ex 1: To select logarithmic regression and input the following data: (170,
66), (173, 68), (179, 75)
(Select Type)(y=a+b・ln(x))
20

 Loading...