EasyManua.ls Logo

Casio fx-6200G - Page 39

Casio fx-6200G
60 pages
Print Icon
To Next Page IconTo Next Page
To Previous Page IconTo Previous Page
Loading...
i
hs.
not
be
produced
in
these
modes.
The
BASE-N
mode
cannot
be
used
for
grap
;
poy:
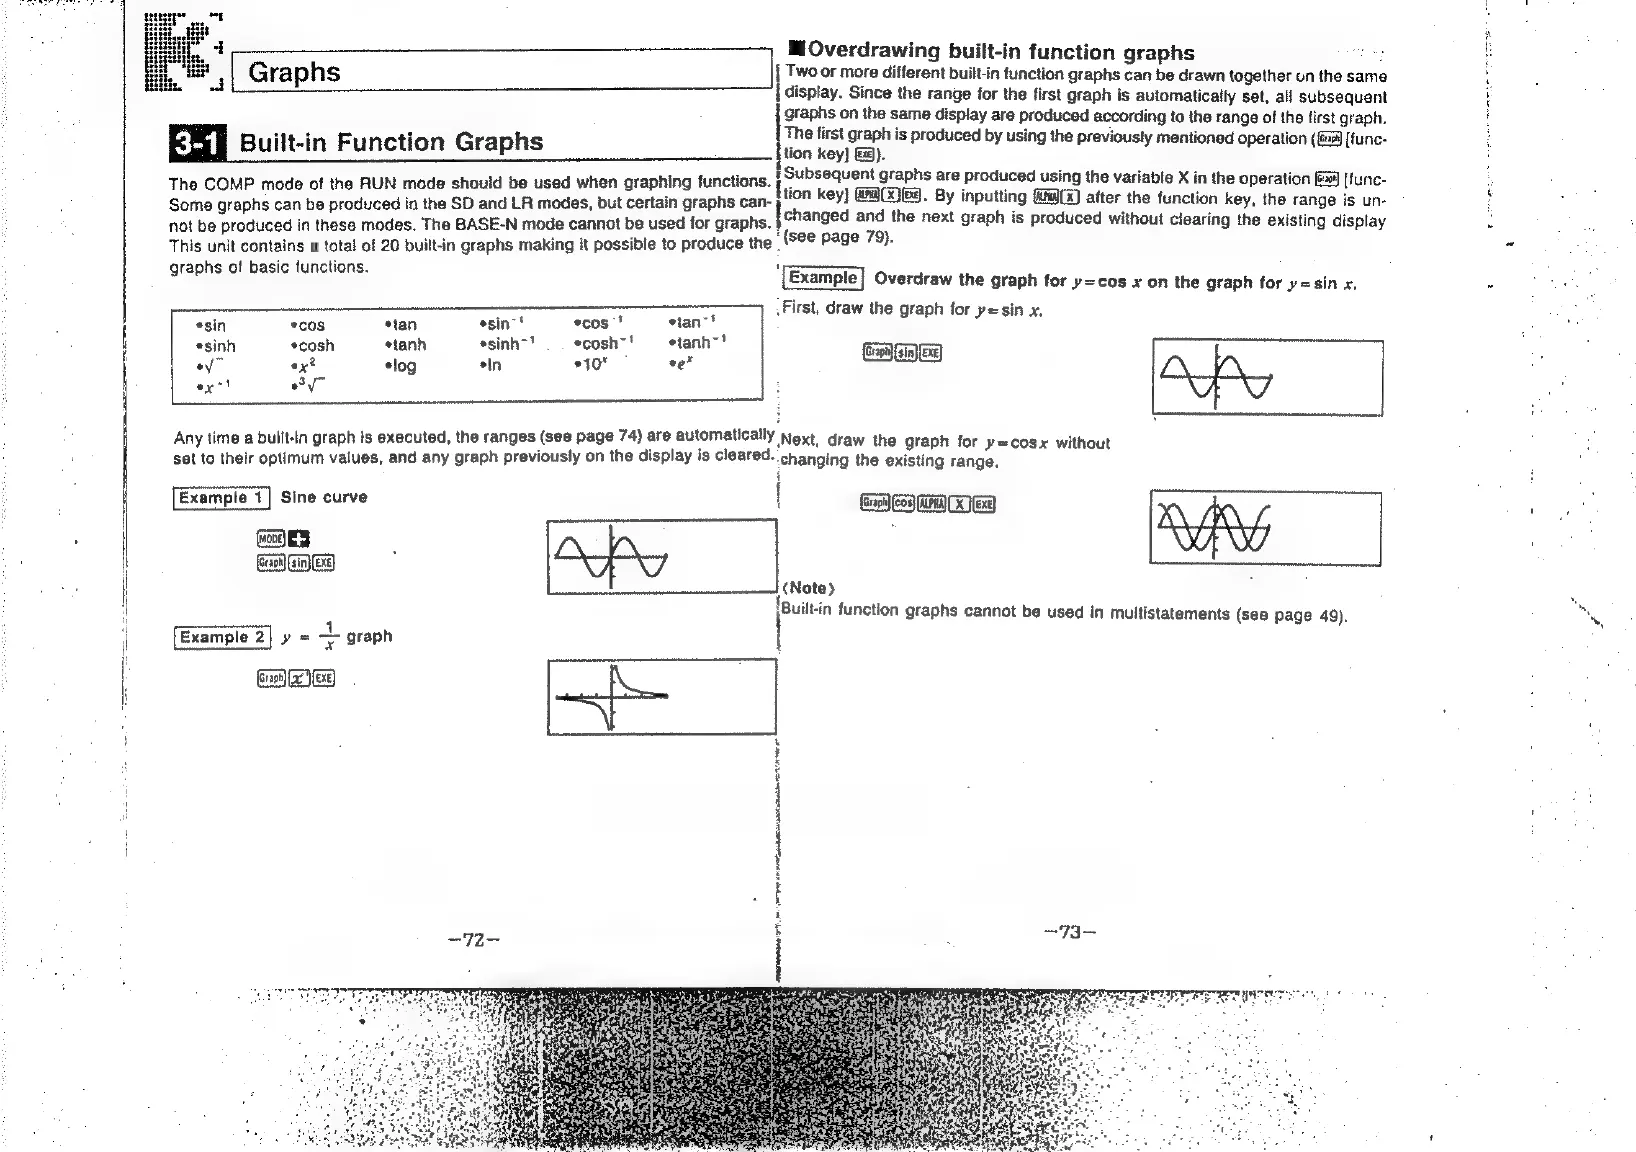
This
unit
contains
a
total
of
20
built-in
graphs
making
it
possible
to
produce
the
“(see
page
79)
graphs
of
basic
functions.
.First,
draw
the
graph
for
y=sin
x.
*sin
*cos
elan
sin’!
*cos'
olan
{
esinh
*cosh
etanh
*sinh"'
*cosh"'
etanh
ces
ea
ov
ex?
*log
ein
10°
ee*
f
ex!
oy
Any
time
a
built-in
graph
Is
executed,
the
ranges
(see
page
74)
are
automatically
Next,
draw
the
graph
for
y=cosx
without
|
sat
to
their
optimum
values,
and
any
graph
previously
on
the
display
is
cleared.
changing
the
existing
range.
i
Example
1|
Sine
curve
|
GE
GoOE
Galineg
4
(Note)
y
=F
arapn
Gaiaeg
PF
Je
SM
rl
Ra
NS
POET
ye
MOverdrawing
built-in
function
graphs
:
|
Two
or
more
different
built-in
function
graphs
can
be
drawn
together
un
the
same
j
display.
Since
the
range
for
the
first
graph
is
automatically
set,
ail
subsequent
graphs
on
the
same
display
are
produced
according
to
the
range
of
the
first
graph.
Seen
¢
\
The
first
graph
is
produced
by
using
the
previously
mentioned
operation
(fa
[func-
Built-in
Function
Graphs
}tion
key}
62).
:
Subsequent
graphs
are
produced
using
the
variable
X
in
the
operation
9]
[func-
tions.
j
The
COMP
mode
of
the
RUN
mode
Ee
erie
Ca
une
can,
{tion
key]
@9009.
By
inputting
HW)
after
the
function
key,
the
range
is
un-
Some
graphs
can
be
produced
in
the
SD
an
Modes.
Ichanged
and
the
next
graph
is
produced
without
clearing
the
existing
display
‘[Example]
Overdraw
the
graph
for
y=cos
x
on
the
graph
for
y=sin
x.
ne
|
jBuilt-in
function
graphs
cannot
be
used
in
multistatements
(sea
page
49).