EasyManua.ls Logo

Casio fx-6200G - Page 40

Casio fx-6200G
60 pages
Print Icon
To Next Page IconTo Next Page
To Previous Page IconTo Previous Page
Loading...
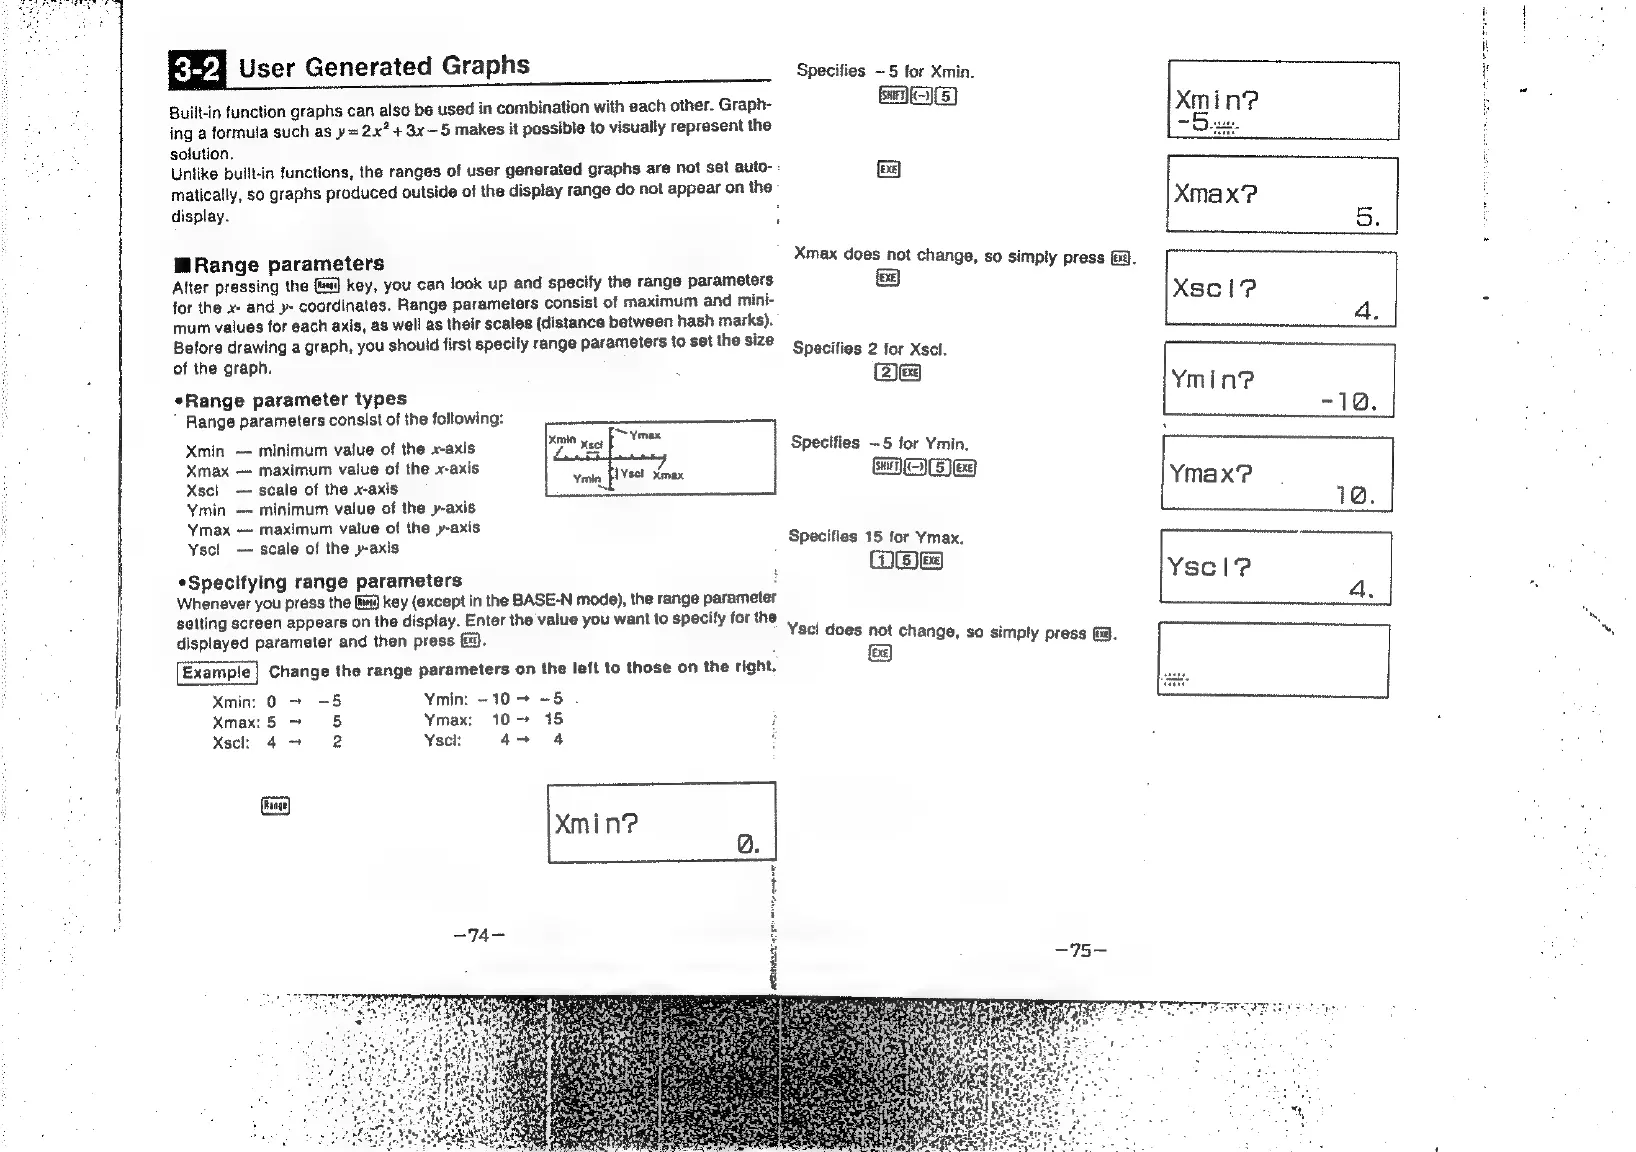
3-2
User
Generated
Graphs
Built-in
function
graphs
can
also
be
used
in
combination
with
each
other.
Graph-
ing
a
formula
such
as
y=
2x?
4+3x—5
makes
it
possible
to
visually
represent
the
solution,
Unlike
built-in
functions,
the
ranges
of
user
generated
graphs
are
not
set
auto-
matically,
so
graphs
produced
outside
of
the
display
range
do
not
appear
on
the
display.
mMRange
parameters
Alter
pressing
the
G49
key,
you
can
look
up
and
specify
the
range
parameters
for
the
x»
and
»-
coordinates.
Range
parameters
consist
of
maximum
and
mini-
mum
values
for
each
axis,
as
well
as
their
scales
(distance
between
hash
marks).
Before
drawing
a
graph,
you
should
first
specify
range
parameters
to
set
the
size
of
the
graph.
*Range
parameter
types
"
Range
parameters
consist
of
the
following:
Xmin
—
minimum
value
of
the
x-axis
Xmax
—
maximum
value
of
the
x-axis
Xscl_
—
scale
of
the
x-axis
Ymin
-—-
minimum
value
of
the
y-axis
Ymax
—
maximum
value
of
the
y-axis
Yscl
—
scale
of
the
y-axis
*Specifying
range
parameters
:
Whenever
you
press
the
fai)
key
(except
in
the
BASE-N
mode),
the
range
parameter
setting
screen
appears
on
the
display.
Enter
the
value
you
want
to
specify
for
the
displayed
parameter
and
then
press
{.
Example
|
Change
the
range
parameters
on
the
left
to
those
on
the
right.
Xmin:
0
+
-5
Ymin:
~10
7
-5
Xmax:5
>
5
Ymax:;
10-+
18
Xscli
4
2
Yscl:
47
4
Xmin?
-74-
Specifies
~5
for
Xmin.
SAE)
fg
Xmax
does
not
change,
so
simply
press
3.
&
Specifies
2
for
Xscl.
@esg
Specifies
—5
for
Ymin.
MODE
Specifies
15
for
Ymax.
Mes
Yscl
does
not
change,
so
simply
press
(J.
&9
xXmin?
xmax?
5.
xscl?
Lo
Ymin?
-12.
Ymax?
1@.
Yscol?
pia
ae
ee]