EasyManua.ls Logo

Casio fx-6200G - Page 43

Casio fx-6200G
60 pages
Print Icon
To Next Page IconTo Next Page
To Previous Page IconTo Previous Page
Loading...
™@
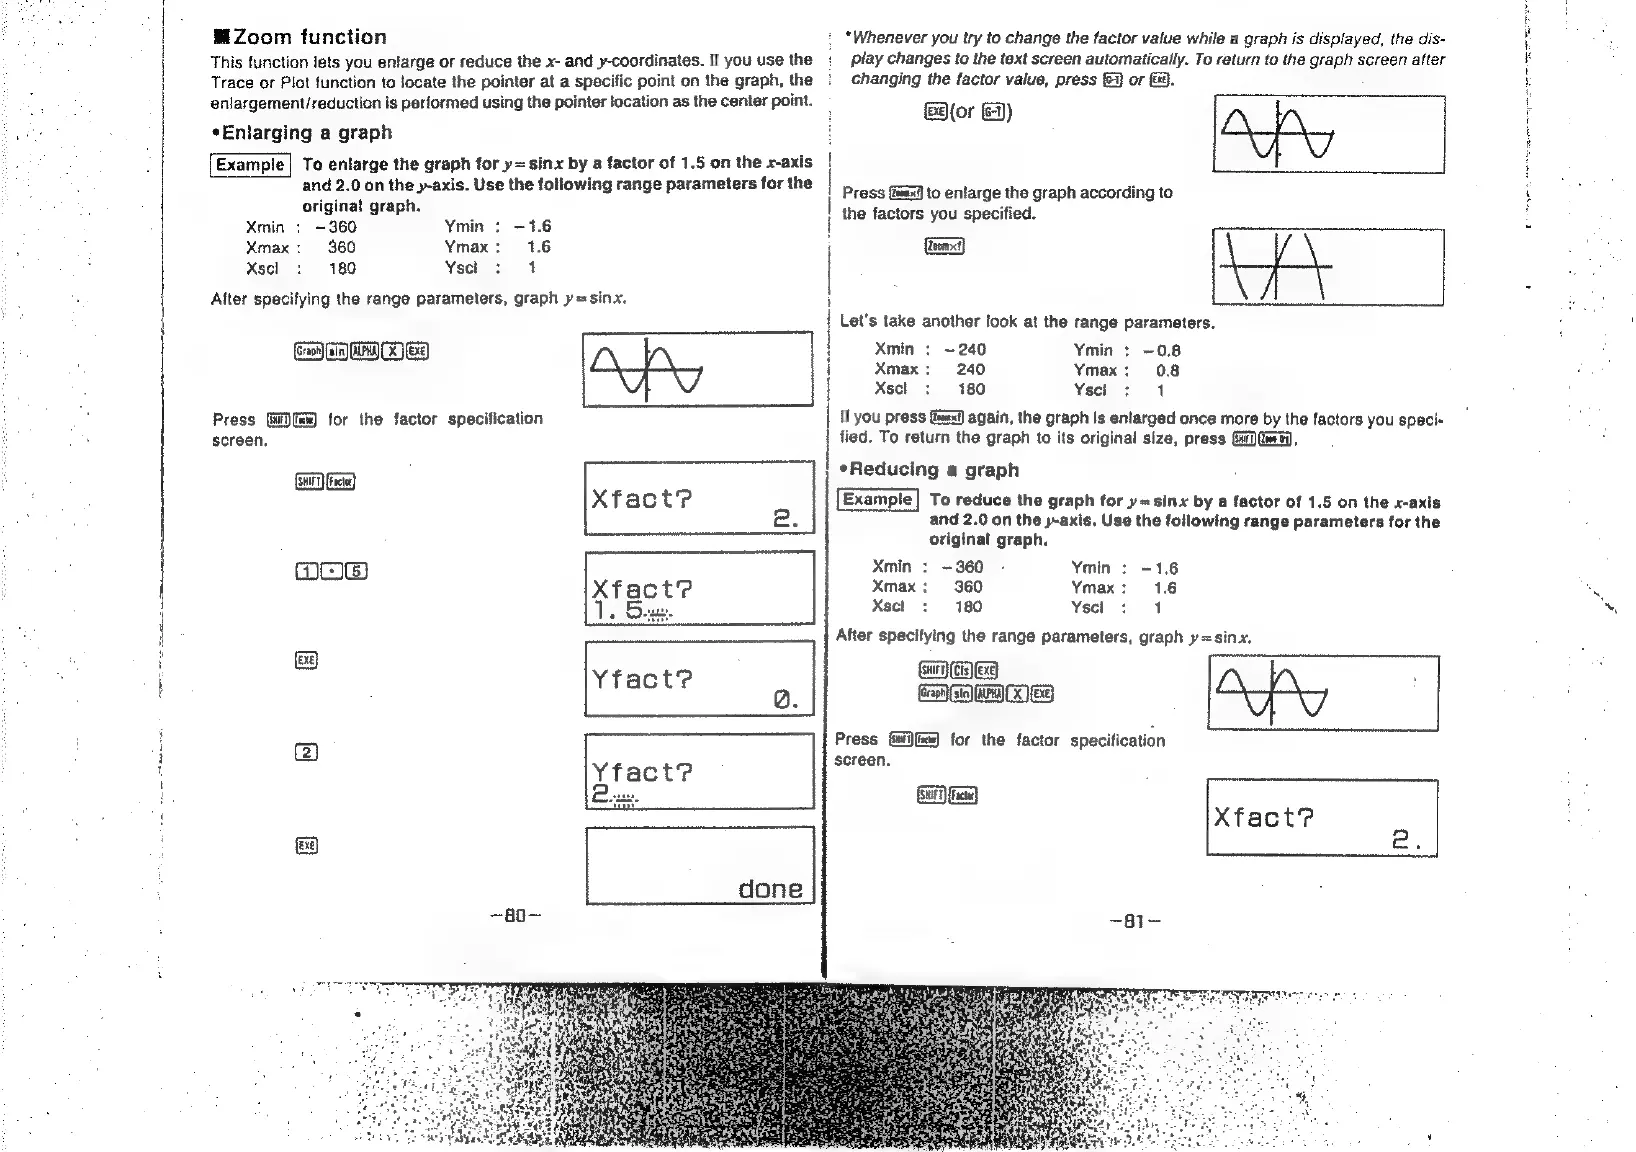
Zoom
function
This
function
lets
you
enlarge
or
reduce
the
x-
and
y-coordinates.
if
you
use
the
Trace
or
Plot
function
to
locate
the
pointer
at
a
specific
point
on
the
graph,
the
enlargement/reduction
is
performed
using
the
pointer
location
as
the
center
point.
*Enlarging
a
graph
Example|
To
enlarge
the
graph
for
y=
sinx
by
a
factor
of
1.5
on
the
x-axis
and
2.0
on
the
y-axis.
Use
the
following
range
parameters
for
the
original
graph.
Xmin
;
~360
Ymin
:
-1.6
Xmax:
360
Ymax:
1.6
Xscl
:
180
Yscl
:
1
After
specifying
the
range
parameters,
graph
y=sinx,
:
*Whenever
you
try
to
change
the
factor
vaiue
while
a
graph
is
displayed,
the
dis-
:
play
changes
to
the
text
screen
automatically.
To
return
to
the
graph
screen
after
!
changing
the
factor
value,
press
or
f.
lor
G2)
Press
fix]
to
enlarge
the
graph
according
to
the
factors
you
specified.
|
Zoom)
t
!
Let's
take
another
look
at
the
tange
parameters.
(eae)
|e
ea
{
Xmin
:
~240
Ymin
:
~0.8
|
Xmax:
240
Ymax:
0.8
Xscl
:
180
Ysel
:
1
Press
Gii)fike)
for
the
factor
specification
|
if
you
press
again,
the
graph
Is
enlarged
once
more
by
the
factors
you
speci-
‘screen,
fied.
To
return
the
graph
to
its
original
size,
press
Ga
Gat),
|
*Reducing
a
graph
To
reduce
the
graph
for
y=
sinx
by
a
factor
of
1.5
on
the
x-axis
and
2.0
on
the
y-axis,
Use
the
following
range
parameters
for
the
original
graph.
Xmin
:
-360
-
Ymin
:
+1.6
OCIS)
Xmax:
360
Ymax:
1.6
Xscl
:
180
Yscl
:
1
After
specifying
the
range
parameters,
graph
y=sinx,
&
Gi)
EES
:
Gane)
9
Press
(wi{fa)
for
the
factor
specification
ie)
screen.
SFT
facta)
Xfact?
ey
.
done