5
Power / Energy: - the display of power levels and the associated parameters (power factor, displacement and
tangent),
- energy metering,
- Four quadrants measurement to discern produced /consumed active energies
and inductive / capacitive reactive energies.
Recording: - time-related representation as bar charts or curves, of mean power levels or of the mean value of any
other parameter,
- mains voltage stability check,
- management of power consumed and generated (most economical choice with energy distributor),
- monitoring of harmonic variations,
Alarms: - a list of the alarms recorded according to the thresholds programmed during configuration,
- logging of supply network interruption with half-period resolution (Vrms, Arms, Urms),
- determination of energy consumption overruns,
- checking of compliance with energy supply quality contract.
➅ 4 keys: and which enable movement of the cursor, browsing or the selection of data.
➆ Validation key
➇ Network supply connector
➈ IR RS232 bidirectional optical output for transferring data to a PC (bidirectional) or printing to a dedicated printer (DPU 414 - SEIKO).
➉ 4 voltage inputs situated on the top of the instrument
Protective case
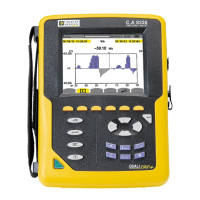
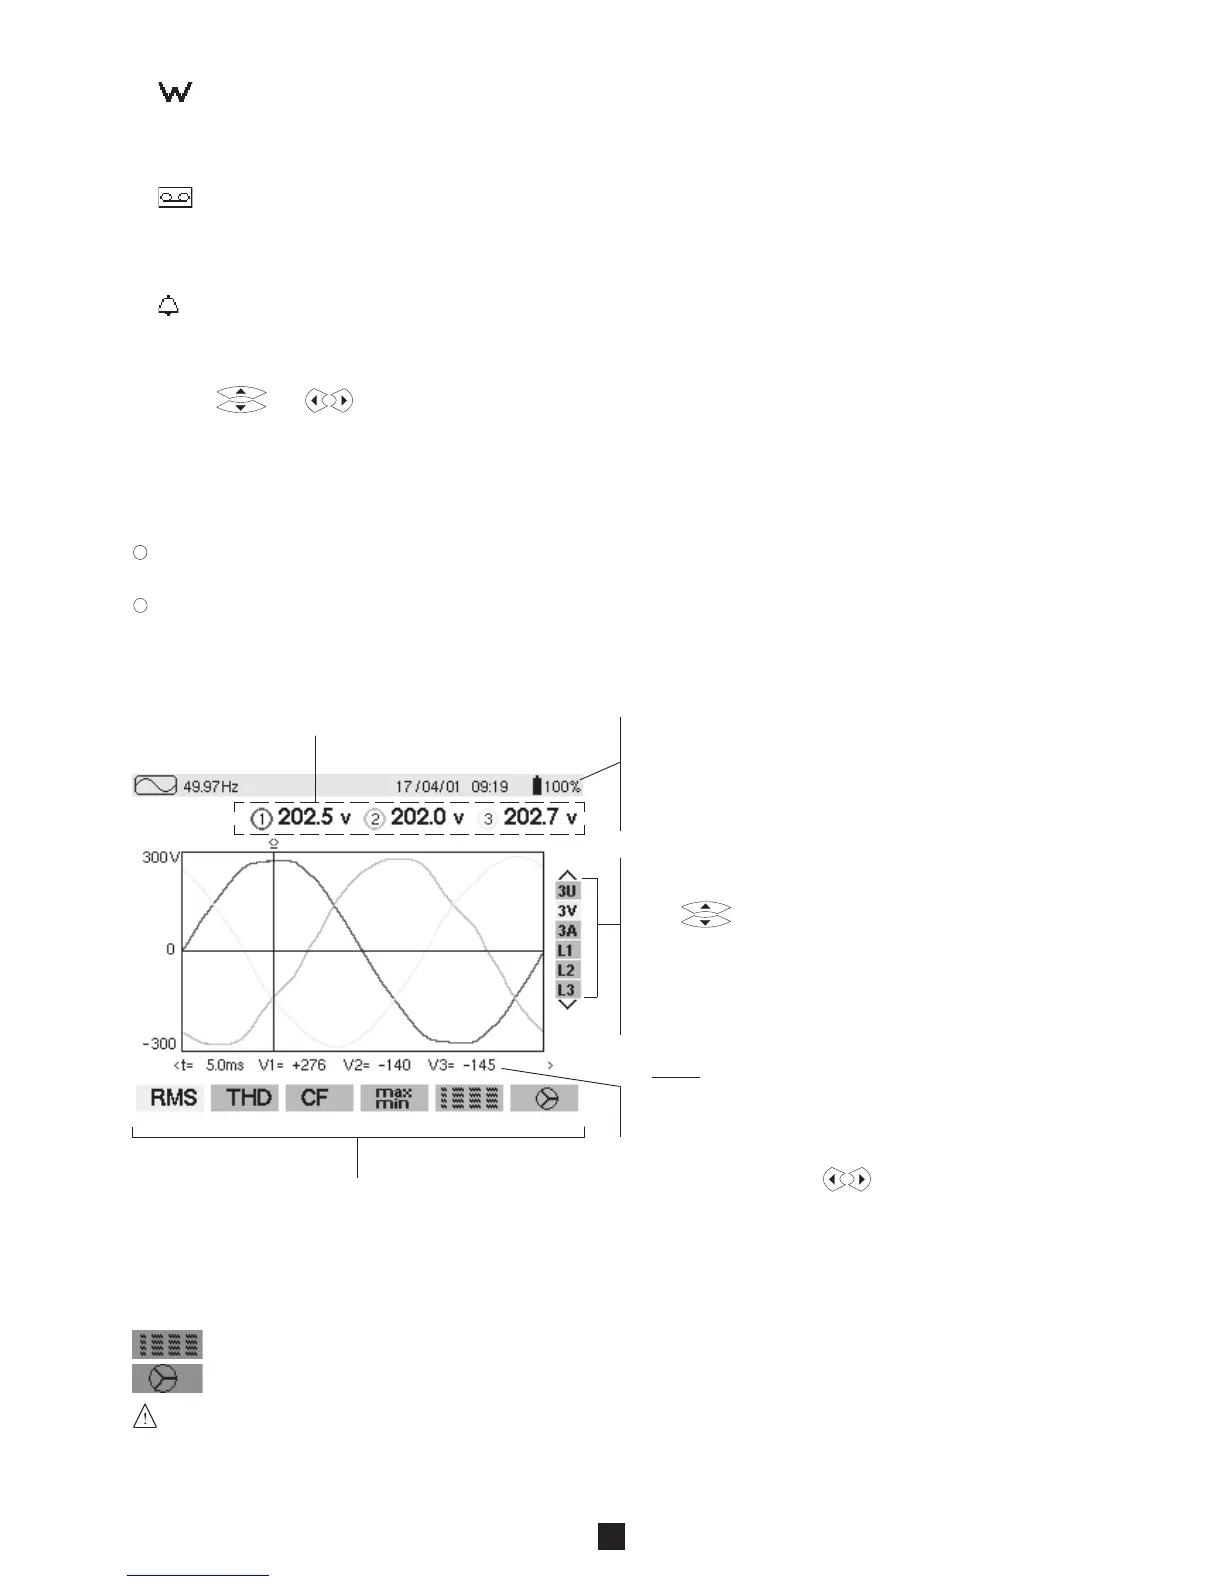
2.2 Display
Measurement values associated with curves Important parameters concerning the instrument:
- Display mode
- The frequency of the measured network
- The proportion of memory occupied for certain modes
- The current date and time
- The battery charge status (see § 2.3)
Selection of the curves to display by pressing on the
keys :
- 3U displays the three compound voltages U12, U23, U31,
- 3V displays the 3 phase-to-phase voltages V1N, V2N, V3N,
- 3A displays the three phase currents and 4A with the
neutral current of a three-phase system,
- L1, L2 or L3 display the current and voltage in turn on phase
1, 2 or 3.
Nota : the stability of the display requires the first measured
magnitude of each selection.
Instant values of signals at an instant “t”, at the intersection
of the cursor and the curves. The cursor is moved along the
time scale with the keys .
Selection of the measurement type using the variable function keys ➁, situated below the screen:
RMS True RMS measurement
THD Overall harmonic distortion factor
CF Crest factor
max/min Extreme and average values
Simultaneous display of the various measurements
Fresnel diagram of signals
The calculation of the DPF, Tan, KF, φ, UNB, Min, Max, VAR, Harmonics, PST, and DF parameters and the frequency
measurement can only be performed if Ch 1, with voltage V1, is connected to the network.
 Loading...