36
CONTOUR
®
TS meter CONTOUR
®
TS test strips
Technical,
Service & Care
Technical Information
Technical Information
Table 5 – System intermediate precision results for
CONTOUR TS meter using CONTOUR TS test strips
Control
Level
Mean,
mmol/L
Standard
Deviation,
mmol/L
95% Confi dence Interval
of Standard Deviation,
mmol/L
Coeffi cient of
Variation, %
Low 2.21 0.03 0.031 – 0.037 1.5
Normal 6.79 0.09 0.083 – 0.098 1.3
High 19.87 0.25 0.230 – 0.273 1.3
Precision
Table 4 – System repeatability results for
CONTOUR
®
TS meter using CONTOUR
®
TS test strips
Mean, mmol/L
Pooled Standard
Deviation mmol/L
95% Confi dence Interval
of Standard Deviation,
mmol/L
Coeffi cient
of Variation,
%
2.20 0.08 0.073 – 0.086 3.6
4.22 0.10 0.094 – 0.112 2.4
7.31 0.16 0.143 – 0.170 2.1
11.06 0.19 0.172 – 0.204 1.7
18.14 0.27 0.248 – 0.294 1.5
Intermediate precision (which includes variability across
multiple days) was evaluated using 3 control solutions. With
each of 3 lots of CONTOUR TS test strips, each control was
tested once on each of 10 instruments on 10 separate days
for a total of 300 readings.
5718657_CntrTS_Karajishi_UG_EN_FpBp_v0.indd 36 3/24/17 4:13 AM
37
Technical,
Service & Care
BA
Service Information
Service Information
If you have a problem and none of the problem solving steps
in this user guide help, contact Customer Service. See
the back cover for contact information. We have trained
specialists to help you.
Important
Speak to a Customer Service Representative before
returning your meter for any reason. He/she will give
you the information needed to get your problem handled
correctly and efficiently.
Have your CONTOUR
®
TS blood glucose meter and
CONTOUR
®
TS test strips available when you phone. It
would also be helpful to have a bottle of C
ONTOUR
®
TS
control solution nearby.
Check List
This check list may be helpful when speaking with
CustomerService:
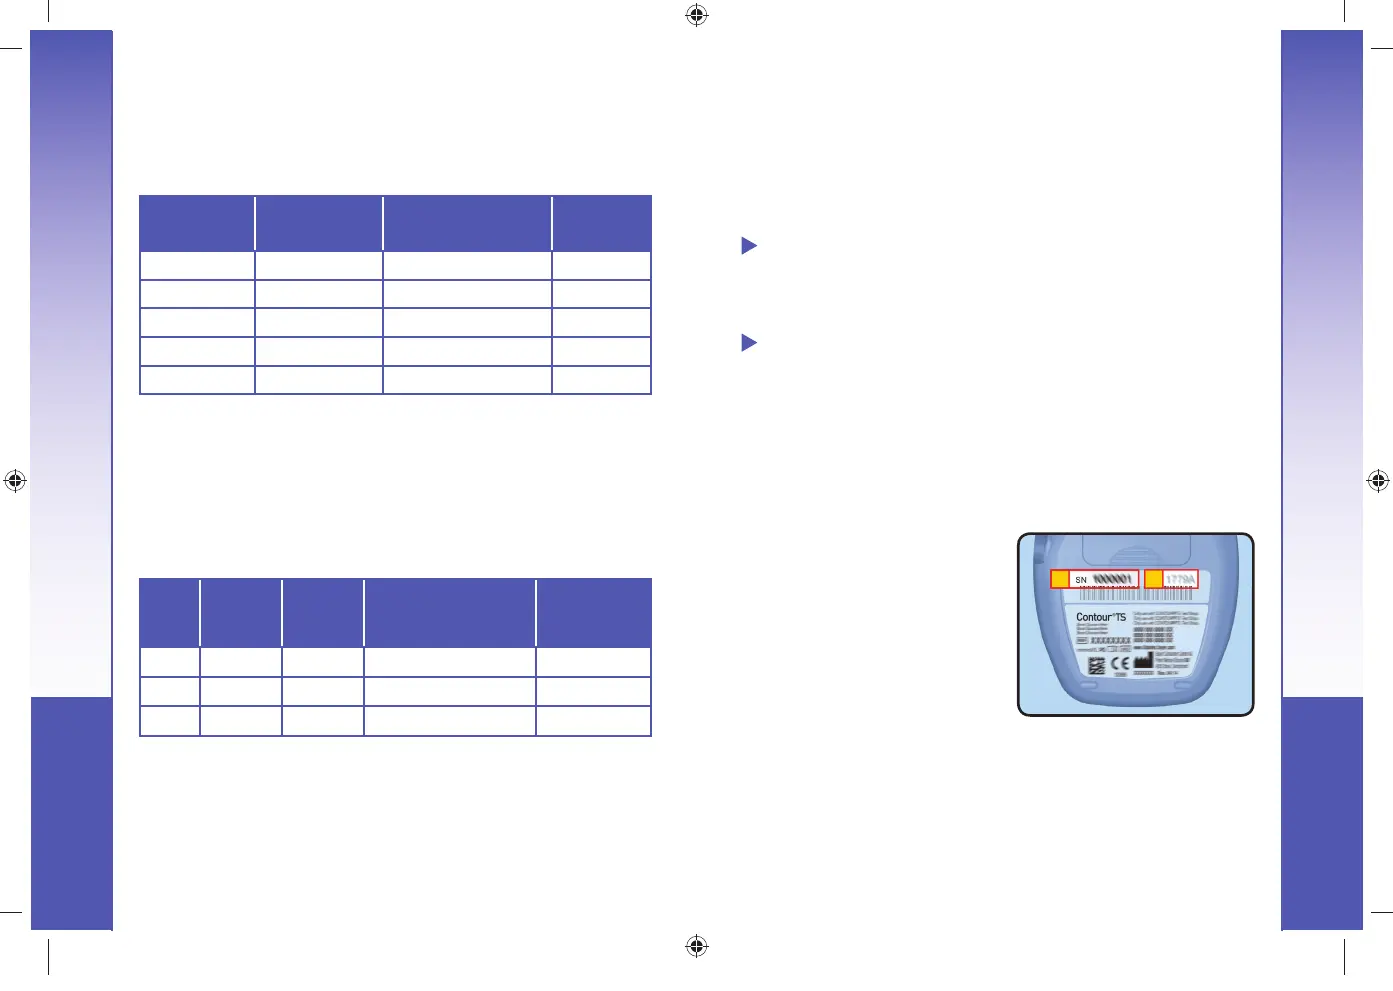
1. Locate the serial number (A)
and model number (B) on
the back of the meter.
_______________________
_______________________
2. Locate the C
ONTOUR TS
test strips’ expiry date on
the bottle.
_______________________
3. Check the battery icon on the display. (See page 28,
Changing the Battery.)
5718657_CntrTS_Karajishi_UG_EN_FpBp_v0.indd 37 3/24/17 4:13 AM
37
Technical,
Service & Care
BA
Service Information
Service Information
If you have a problem and none of the problem solving steps
in this user guide help, contact Customer Service. See
the back cover for contact information. We have trained
specialists to help you.
Important
Speak to a Customer Service Representative before
returning your meter for any reason. He/she will give
you the information needed to get your problem handled
correctly and efficiently.
Have your CONTOUR
®
TS blood glucose meter and
CONTOUR
®
TS test strips available when you phone. It
would also be helpful to have a bottle of C
ONTOUR
®
TS
control solution nearby.
Check List
This check list may be helpful when speaking with
CustomerService:
1. Locate the serial number (A)
and model number (B) on
the back of the meter.
_______________________
_______________________
2. Locate the C
ONTOUR TS
test strips’ expiry date on
the bottle.
_______________________
3. Check the battery icon on the display. (See page 28,
Changing the Battery.)
5718657_CntrTS_Karajishi_UG_EN_FpBp_v0.indd 37 3/24/17 4:13 AM
36
CONTOUR
®
TS meter CONTOUR
®
TS test strips
Technical,
Service & Care
Technical Information
Technical Information
Table 5 – System intermediate precision results for
CONTOUR TS meter using CONTOUR TS test strips
Control
Level
Mean,
mmol/L
Standard
Deviation,
mmol/L
95% Confi dence Interval
of Standard Deviation,
mmol/L
Coeffi cient of
Variation, %
Low 2.21 0.03 0.031 – 0.037 1.5
Normal 6.79 0.09 0.083 – 0.098 1.3
High 19.87 0.25 0.230 – 0.273 1.3
Precision
Table 4 – System repeatability results for
CONTOUR
®
TS meter using CONTOUR
®
TS test strips
Mean, mmol/L
Pooled Standard
Deviation mmol/L
95% Confi dence Interval
of Standard Deviation,
mmol/L
Coeffi cient
of Variation,
%
2.20 0.08 0.073 – 0.086 3.6
4.22 0.10 0.094 – 0.112 2.4
7.31 0.16 0.143 – 0.170 2.1
11.06 0.19 0.172 – 0.204 1.7
18.14 0.27 0.248 – 0.294 1.5
Intermediate precision (which includes variability across
multiple days) was evaluated using 3 control solutions. With
each of 3 lots of CONTOUR TS test strips, each control was
tested once on each of 10 instruments on 10 separate days
for a total of 300 readings.
5718657_CntrTS_Karajishi_UG_EN_FpBp_v0.indd 36 3/24/17 4:13 AM
85718657_CntrTS_Karajishi_UG_EN_FpBp_v4_placed.pdf:38
 Loading...