VIEWING AND REDUCING DATA
VIEWING FULL-FIELD DATA
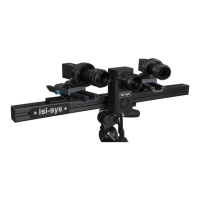
When the analysis is complete, click Close. The new data will be displayed in the Data tab at left; double click on a file to
view.
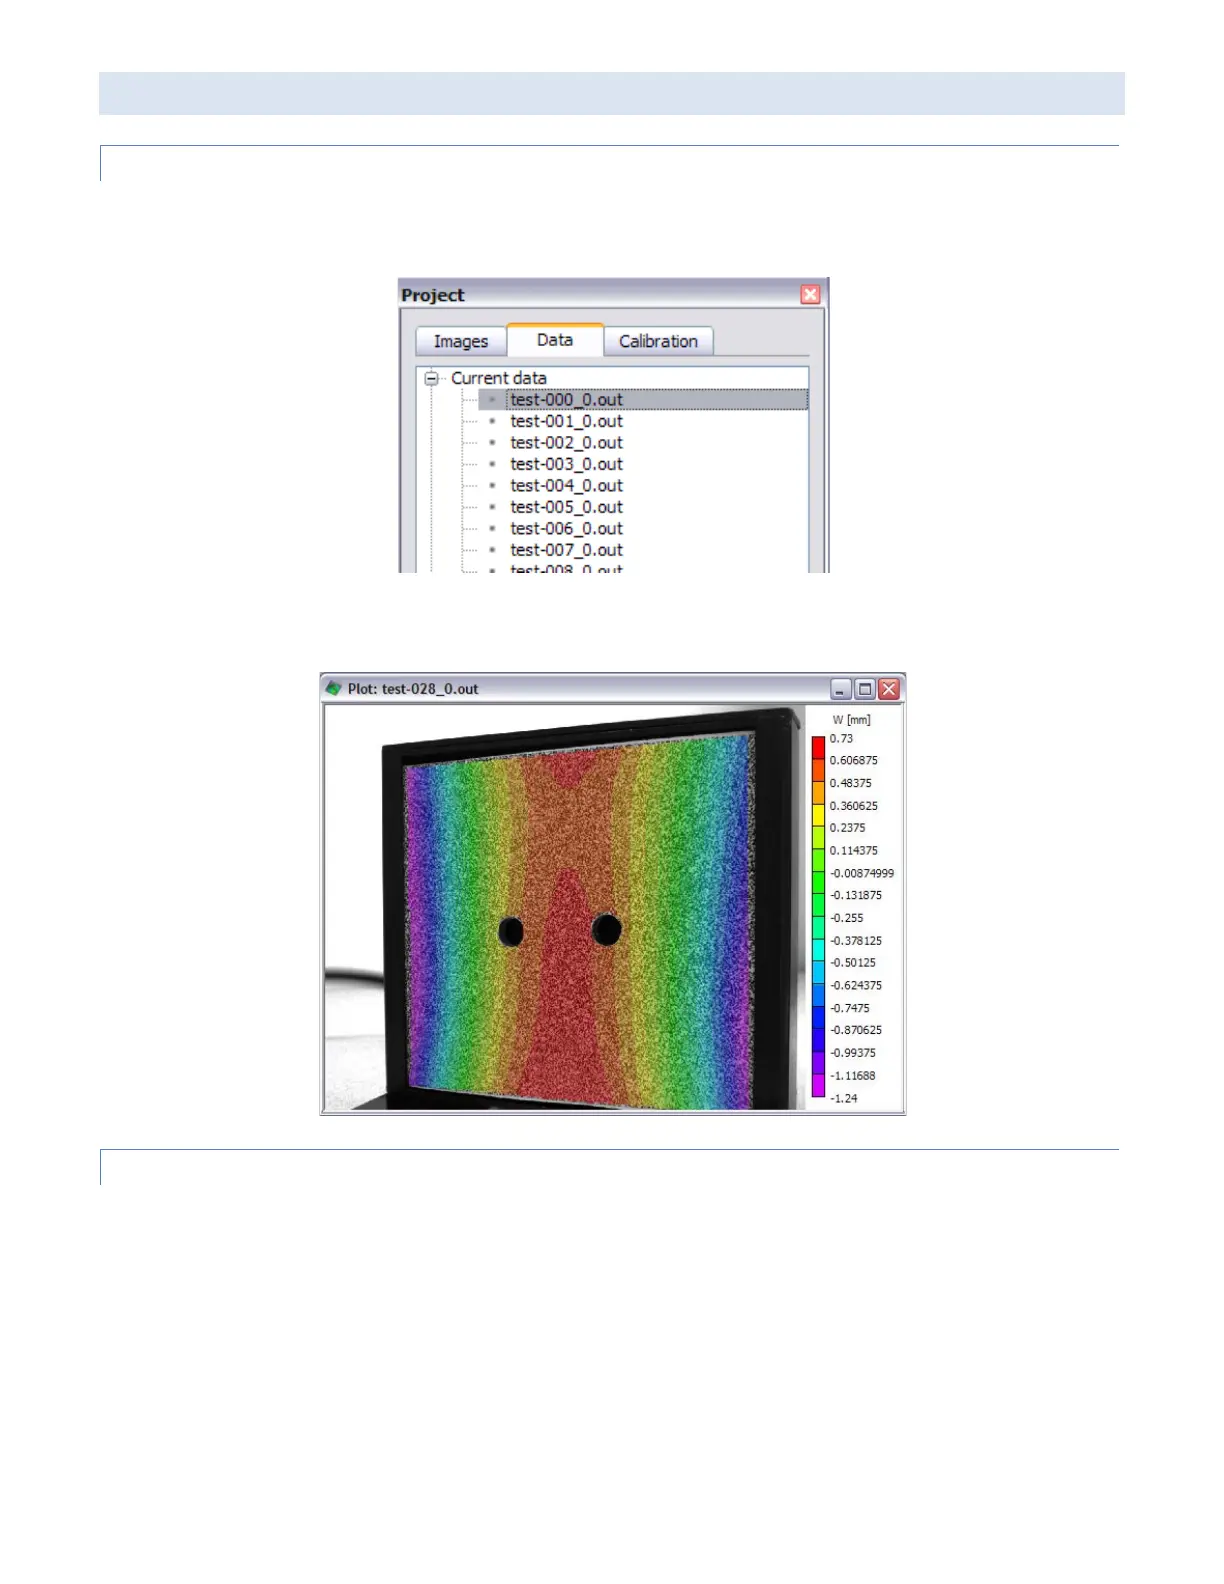
You can click and drag to rotate the data set and use the mouse wheel to zoom in and out. Right click to select different
contour variables. You may also right-click and select Show 2D Plot to see a contour overlay:
AXIS AND CONTOUR LIMITS
Note that both axis and contour limits will auto-scale to the measured minimum and maximum values. For the shape, this
means that very flat shapes will appear very noisy, as the limits will be very close together. The same applies to contours.
For example, if the strain is close to constant, the strain contour plot will have a small range and noise will be exaggerated.
 Loading...