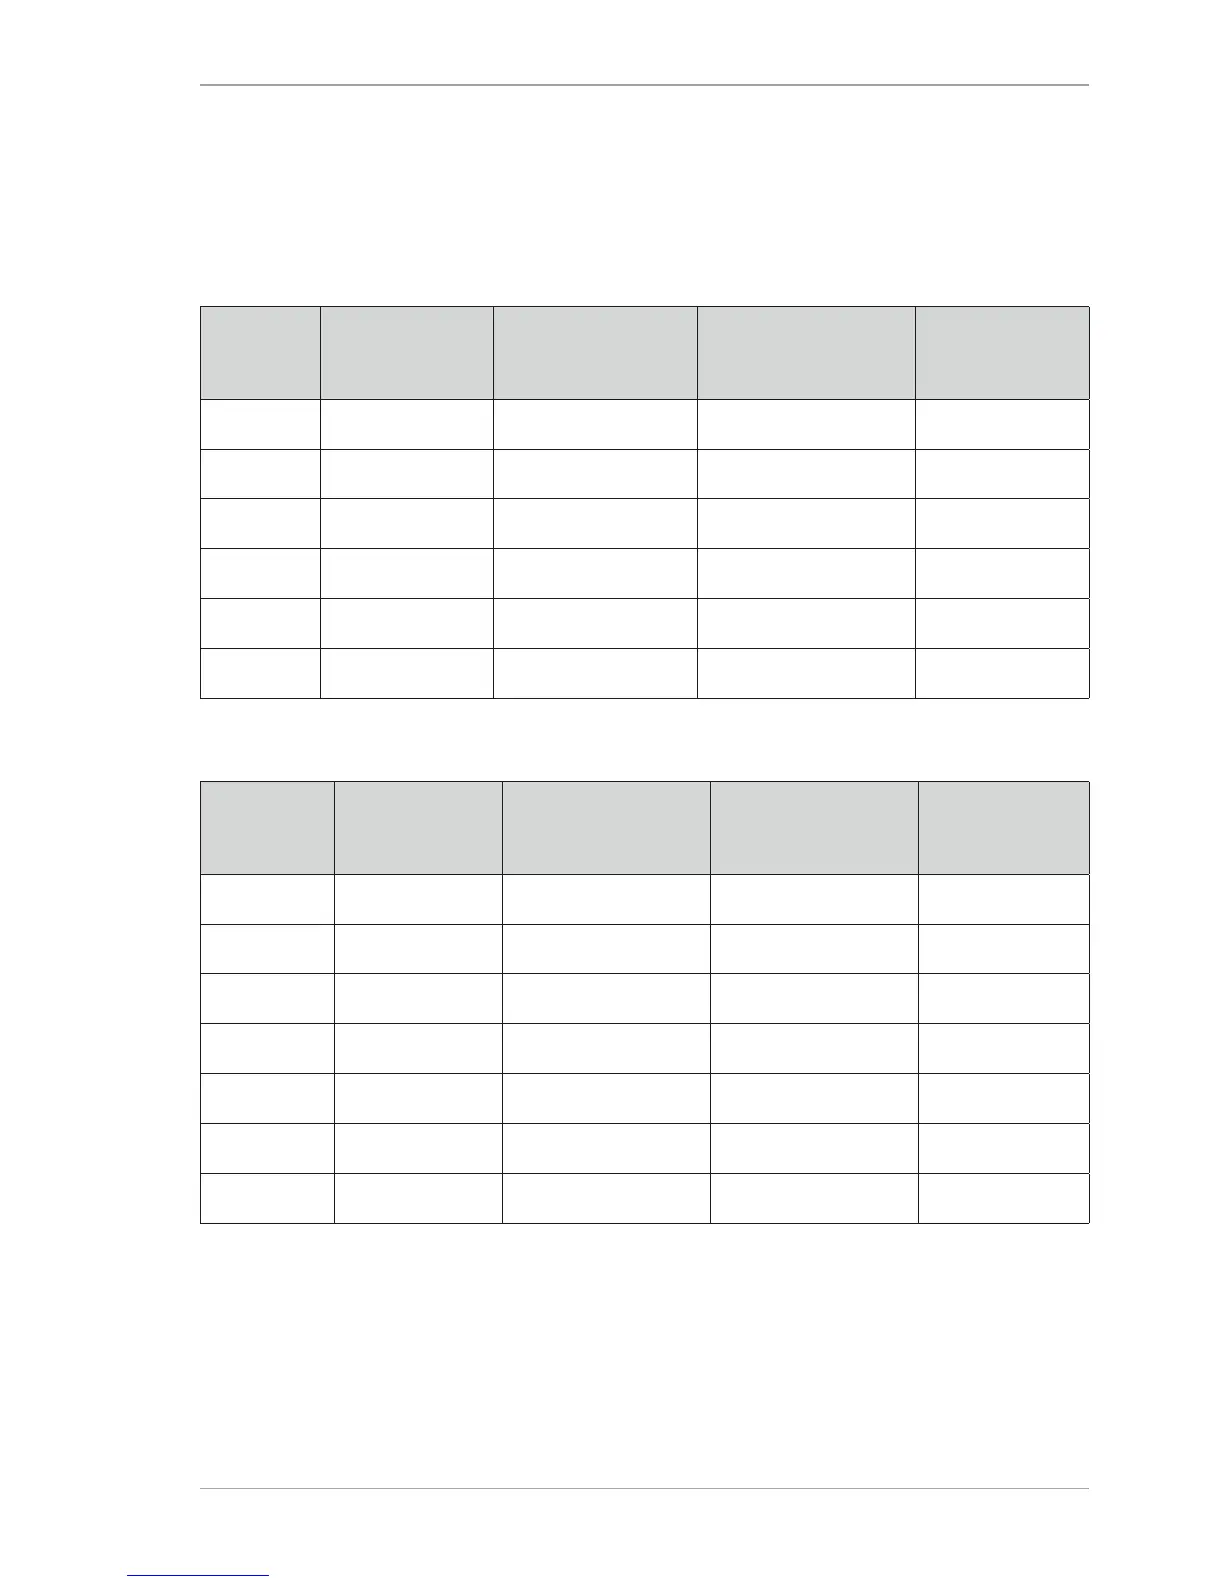
The BMI is not very conclusive as an absolute value. It must be as-
sociated with the gender and age of the person. See the reference
values provided in the following tables.
BMI values for women
Age Under-
weight
Normal
weight
Slight
overweight
Over-
weight
16–24 <19 19–24 25–28 >28
25–34 <20 20–25 26–29 >29
35–44 <21 21–26 27–30 >30
45–54 <22 22–27 28–31 >31
55–64 <23 23–28 29–32 >32
>65 <24 24–29 30–33 >33
BMI values for men
Age Under-
weight
Normal
weight
Slight
overweight
Over-
weight
16 <19 19–24 25–28 >28
17–24 <20 20–25 26–29 >29
25–34 <21 21–26 27–30 >30
35–44 <22 22–27 28–31 >31
45–54 <23 23–28 29–32 >32
55–64 <24 24–29 30–33 >33
>65 <25 25–30 31–34 >34