Data sheet PAH 2/4/6.3, PAH 10/12.5, PAH 20/25/32 and PAH 50/63/70/80/100 pumps
180R9379 | AQ188686503004en-000801 | PAH 2-12.5 | 23
© Danfoss | DCS (im) | 2022.07© Danfoss | DCS (im) | 2022.07
5. Flow The ow (Q
e
) at various pressure (p
max
) can be
calculated with the following equation:
Q
e
= Q
(th)
– [(Q
(th)
– Q (p
max
)) x (p / p
max
)]
The theoretical ow can be calculated with the
following equation:
V x n
Q
(th)
=
1000
At zero pressure the true ow equals the
theoretical ow Q
(th)
.
Q
(th)
: Theoretical ow (l/min / gpm)
Q (p
max
): Flows at max. pressure (l/min and
gpm), see 4.1-4.4
p
max
: Max pressure (barg / psig)
p: Pressure (barg / psig)
V: Displacement (cm
3
/ rev.)
n: Motor speed (rpm)
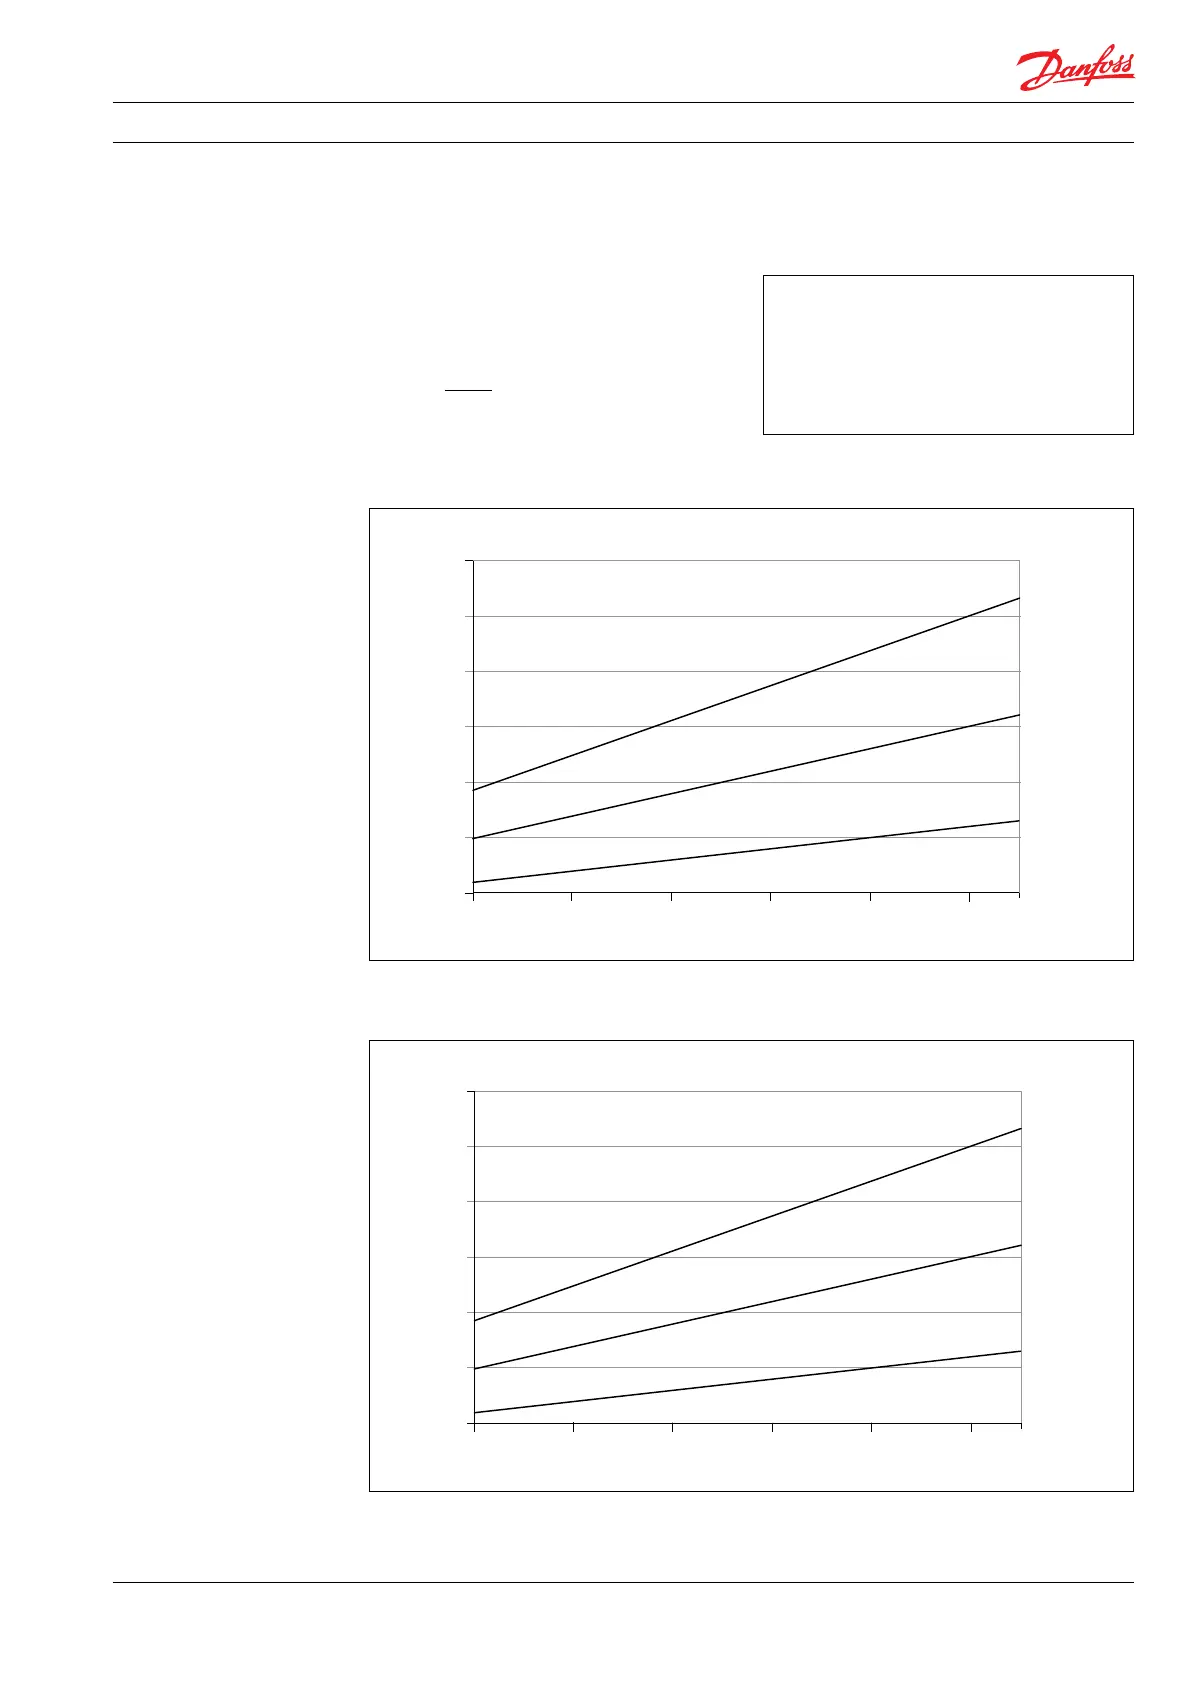
5.1 PAH 2-6.3 typical ow curves at max pressure
12
10
8
6
4
2
0 rpm
PAH 2.0
PAH 4.0
PAH 6.3
700
900
1100
1300
1500
1700
1800
3
2.5
2
1.5
1
0.5
0 rpm
PAH 2.0
PAH 4.0
PAH 6.3
gpm
700
900
1100
1300
1500
1700
1800
12
10
8
6
4
2
0 rpm
PAH 2.0
PAH 4.0
PAH 6.3
l/min
700
900
1100
1300
1500
1700
1800
3
2.5
2
1.5
1
0.5
0 rpm
PAH 2.0
PAH 4.0
PAH 6.3
700
900