5
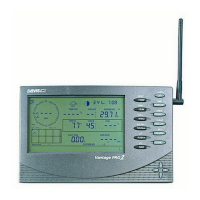
Vantage Pro2
™
Accuracy . . . . . . . . . . . . . . . . . . . . . . . . . . . . . . . . . . . . . ±38 minutes
Rainfall
Resolution and Units . . . . . . . . . . . . . . . . . . . . . . . . . . . . 0.01" or 0.2 mm (user-selectable) (1 mm at totals 2000 mm)
Daily/Storm Rainfall Range . . . . . . . . . . . . . . . . . . . . . . . 0 to 99.99" (0 to 999.8 mm)
Monthly/Yearly/Total Rainfall Range . . . . . . . . . . . . . . . . 0 to 199.99" (0 to 6553 mm)
Rain Rate . . . . . . . . . . . . . . . . . . . . . . . . . . . . . . . . . . . . 0 to 96" (0 to 2438 mm)
Accuracy . . . . . . . . . . . . . . . . . . . . . . . . . . . . . . . . . . . . . For rain rates up to 2"/hr (50 mm/hr): ±3% of total or +0.01" (0.25 mm)
(0.01" = one tip of the bucket), whichever is greater
For rain rates from 2"/hr (50 mm/hr) to 4"/hr (100 mm/hr): ±3% of total
or +0.01" (0.25 mm) (0.01" = one tip of the bucket), whichever is
greater
Update Interval . . . . . . . . . . . . . . . . . . . . . . . . . . . . . . . . 20 to 24 seconds
Storm Determination Method . . . . . . . . . . . . . . . . . . . . . . 0.02" (0.5 mm) begins a storm event, 24 hours without further
accumulation ends a storm event
Current Display Data . . . . . . . . . . . . . . . . . . . . . . . . . . . . Totals for Past 15-min
Current Graph Data. . . . . . . . . . . . . . . . . . . . . . . . . . . . . Totals for Past 15-min, Past 24-hour, Daily, Monthly, Yearly (start date
user-selectable) and Storm (with begin date); Umbrella is displayed
when 15-minute total exceeds zero
Historical Graph Data . . . . . . . . . . . . . . . . . . . . . . . . . . . Totals for 15-min, Daily, Monthly, Yearly (start date user-selectable)
and Storm (with begin and end dates)
Alarms . . . . . . . . . . . . . . . . . . . . . . . . . . . . . . . . . . . . . . High Threshold from Latest Flash Flood (15-min. total, default is 0.50",
12.7 mm), 24-Hour Total, Storm Total,
Range for Rain Alarms . . . . . . . . . . . . . . . . . . . . . . . . . . 0 to 99.99" (0 to 999.7 mm)
Rain Rate
Resolution and Units . . . . . . . . . . . . . . . . . . . . . . . . . . . . 0.01" or 0.1mm (user-selectable) at typical rates (see Fig. 2 and 3)
Range . . . . . . . . . . . . . . . . . . . . . . . . . . . . . . . . . . . . . . . 0, 0.04"/hr (1 mm/hr) to 96"/hr (0 to 2438 mm/hr)
Accuracy . . . . . . . . . . . . . . . . . . . . . . . . . . . . . . . . . . . . . ±5% for rates less than 5" per hour (127 mm/hr)
Update Interval . . . . . . . . . . . . . . . . . . . . . . . . . . . . . . . . 20 to 24 seconds
Calculation Method . . . . . . . . . . . . . . . . . . . . . . . . . . . . . Measures time between successive tips of rain collector. Elapsed time
greater than 15 minutes or only one tip of the rain collector constitutes
a rain rate of zero.
Current Display Data . . . . . . . . . . . . . . . . . . . . . . . . . . . . Instant
Current Graph Data. . . . . . . . . . . . . . . . . . . . . . . . . . . . . Instant and 1-min. Reading; Hourly, Daily, Monthly and Yearly High
Historical Graph Data . . . . . . . . . . . . . . . . . . . . . . . . . . . 1-min Reading; Hourly, Daily, Monthly and Yearly Highs
Alarm . . . . . . . . . . . . . . . . . . . . . . . . . . . . . . . . . . . . . . . High Threshold from Instant Reading
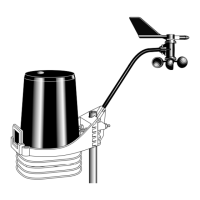
Solar Radiation (requires solar radiation sensor)
Resolution and Units . . . . . . . . . . . . . . . . . . . . . . . . . . . . 1 W/m
2
Range . . . . . . . . . . . . . . . . . . . . . . . . . . . . . . . . . . . . . . . 0 to 1800 W/m
2
Accuracy . . . . . . . . . . . . . . . . . . . . . . . . . . . . . . . . . . . . . ±5% of full scale (Reference: Eppley PSP at 1000 W/m
2
)
Drift. . . . . . . . . . . . . . . . . . . . . . . . . . . . . . . . . . . . . . . . . up to ±2% per year
Cosine Response . . . . . . . . . . . . . . . . . . . . . . . . . . . . . . ±3% for angle of incidence from 0° to 75°
Temperature Coefficient . . . . . . . . . . . . . . . . . . . . . . . . . -0.067% per °F (-0.12% per °C); reference temperature = 77°F (25 °C)
Update Interval . . . . . . . . . . . . . . . . . . . . . . . . . . . . . . . . 50 seconds to 1 minute (5 minutes when dark)
Current Graph Data. . . . . . . . . . . . . . . . . . . . . . . . . . . . . Instant Reading and Hourly Average; Daily, Monthly High
Historical Graph Data . . . . . . . . . . . . . . . . . . . . . . . . . . . Hourly Average, Daily, Monthly Highs
Alarm . . . . . . . . . . . . . . . . . . . . . . . . . . . . . . . . . . . . . . . High Threshold from Instant Reading
Sunrise and Sunset
Resolution. . . . . . . . . . . . . . . . . . . . . . . . . . . . . . . . . . . . 1 minute
Accuracy . . . . . . . . . . . . . . . . . . . . . . . . . . . . . . . . . . . . . ±1 minute
Reference . . . . . . . . . . . . . . . . . . . . . . . . . . . . . . . . . . . . United States Naval Observatory
 Loading...