10
The ProSignal Go / Basic / Klicks software (optionally available) enables you to clearly display
measured data as trends in diagrams (e.g. y(x), y(t), logic diagram) and then to analyse and export
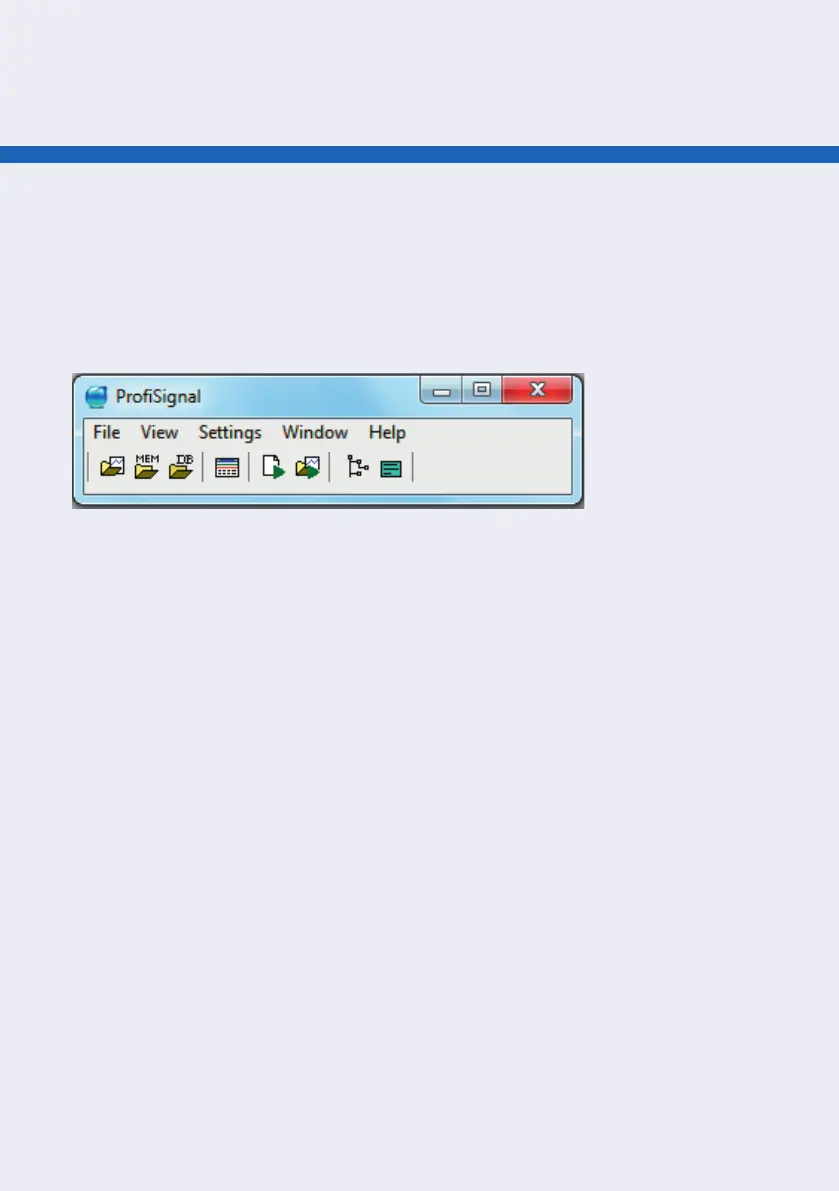
the data. After you have started the ProSignal software, create a new online analysis by clicking
on “File“ → “Create new Online Analysis...“.
STARTING ONLINE ANALYSIS
After selecting the diagram type y(t), a channel selection box opens. The channels to be displayed
are selected and added to the selected channels on the right channel using the “Add“ button.
Clicking “OK“ opens the trend and displays incoming measurement data. If the measured data
isn’t being displayed, go to NTP time synchronization in the online help (F1).