12
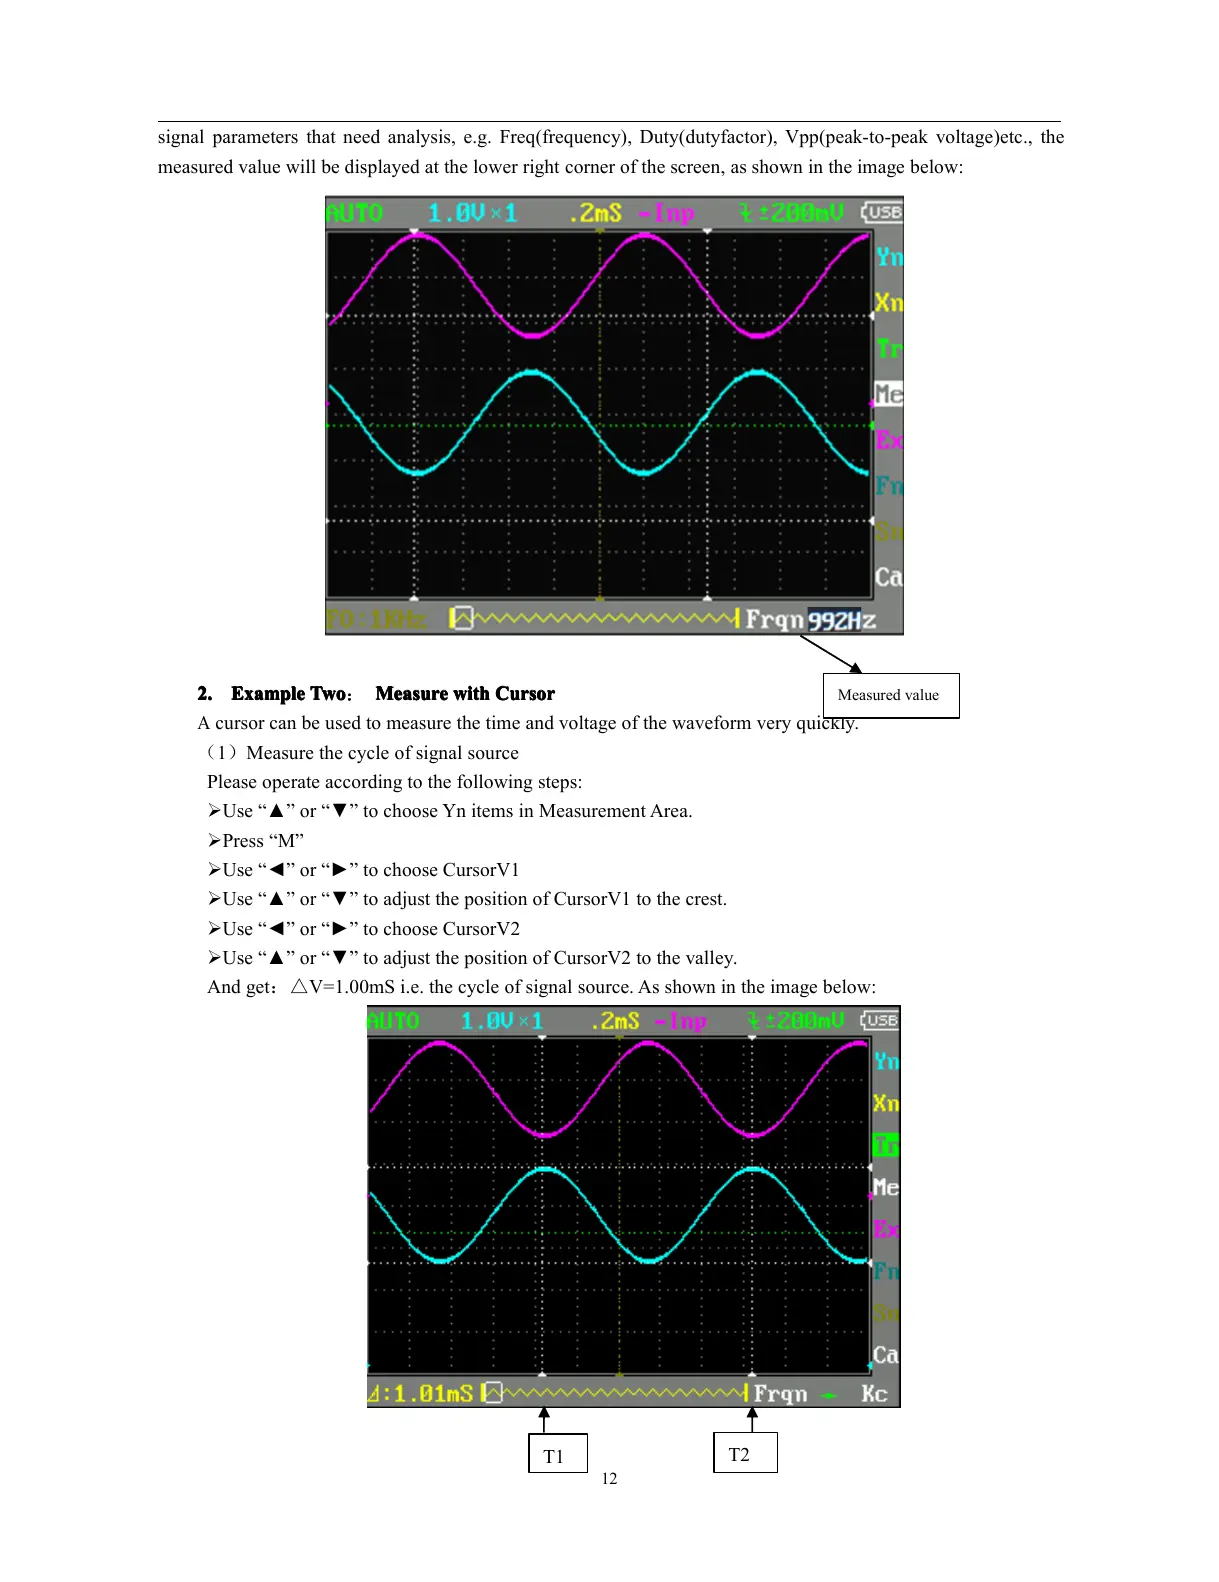
signal parameters that need analysis, e.g. Freq(frequency), Duty(dutyfactor), Vpp(peak-to-peak voltage)etc., the
measured value will be displayed at the lower right corner of the screen, as shown in the image below:
2.
2.
2.
2. Example
Example
Example
Example Two
Two
Two
Two : Measure
Measure
Measure
Measure with
with
with
with C
C
C
C ursor
ursor
ursor
ursor
A
cursor can be used to measure the time and voltage of the waveform very quickly.
( 1 ) Measure the cycle of signal source
Please operate according to the following steps:
� Use “ ▲ ” or “ ▼ ” to choose Yn items in Measurement Area.
� Press “ M ”
� Use “ ◄ ” or “ ► ” to choose CursorV1
� Use “ ▲ ” or “ ▼ ” to adjust the position of CursorV1 to the crest.
� Use “ ◄ ” or “ ► ” to choose CursorV2
� Use “ ▲ ” or “ ▼ ” to adjust the position of CursorV2 to the valley.
And get : △ V= 1.00mS i.e. the cycle of signal source. As shown in the image below:
Measured value
T1
T2