13
( 2 ) Measure peak-to-peak value of the signal source.
Please operate according to following steps:
� Use “ ▲ ” or “ ▼ ” to choose Yn items in Measurement Area
� Press “ OK ”
� Use “ ◄ ” or “ ► ” to choose CursorV1
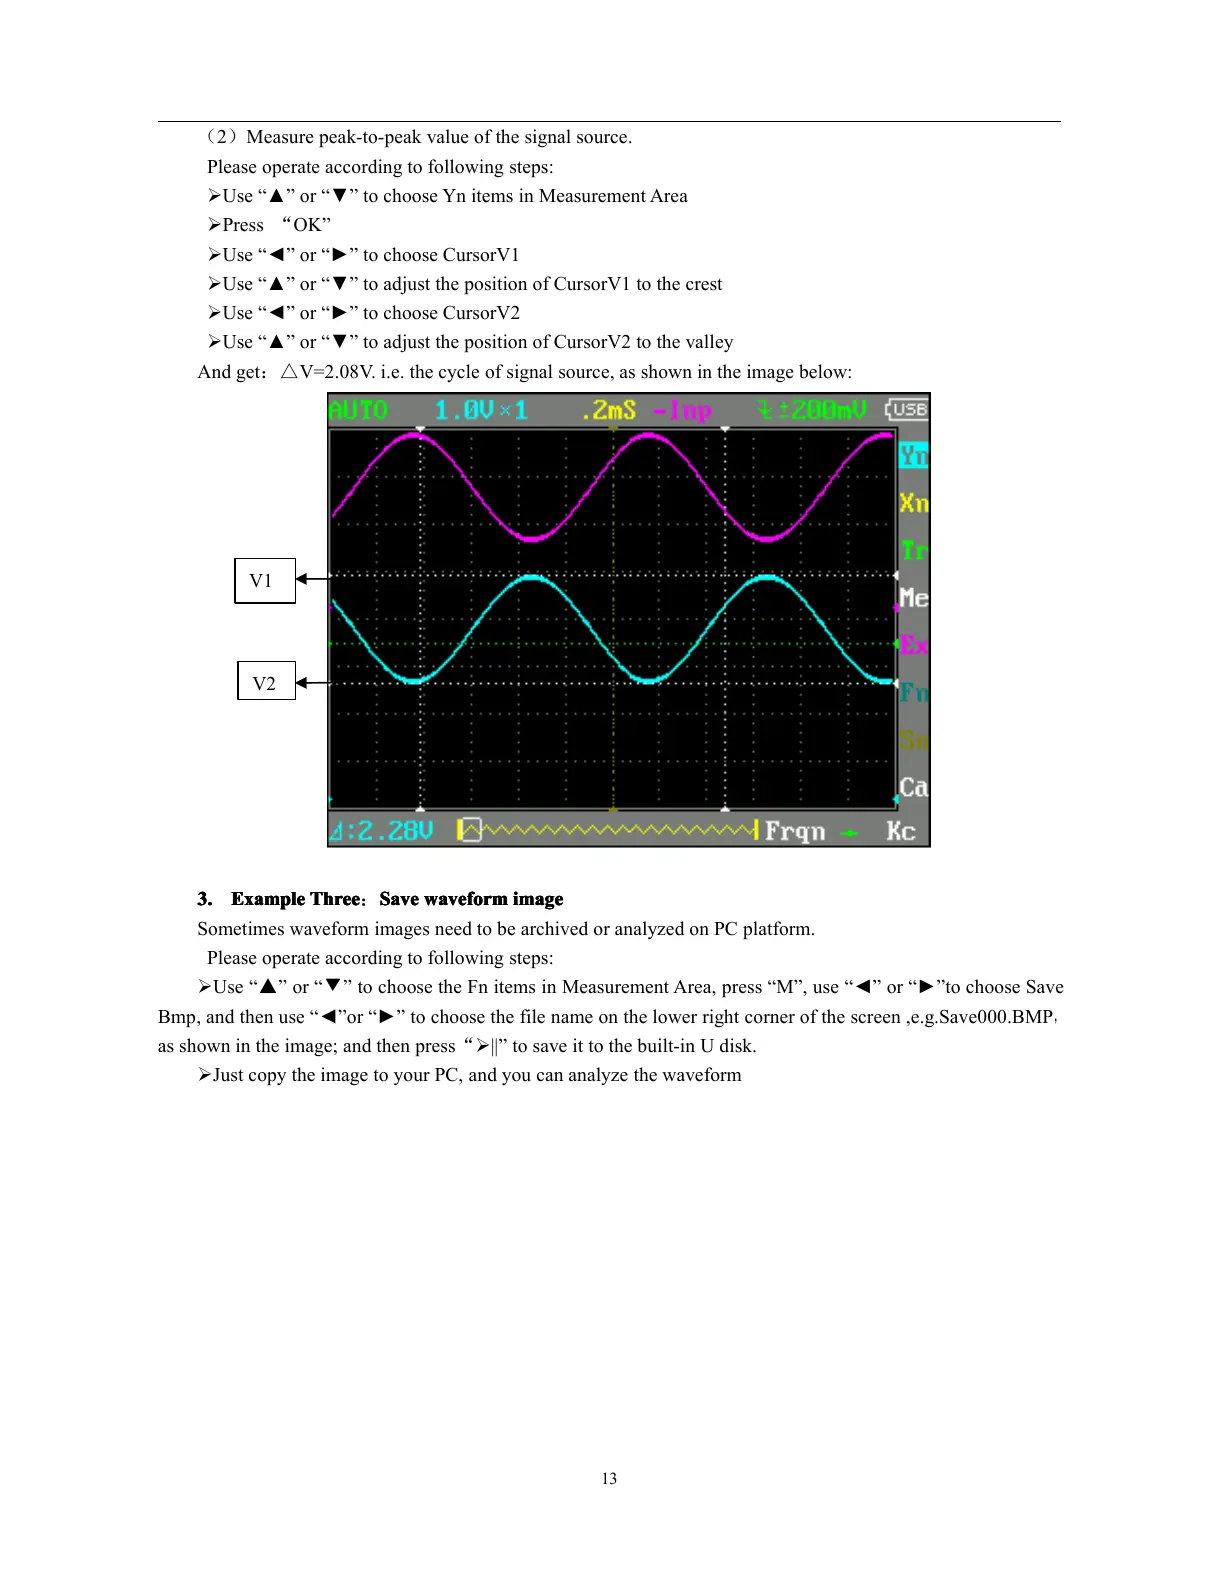
� Use “ ▲ ” or “ ▼ ” to adjust the position of CursorV1 to the crest
� Use “ ◄ ” or “ ► ” to choose CursorV2
� Use “ ▲ ” or “ ▼ ” to adjust the position of CursorV2 to the valley
And get : △ V=2.08V. i.e. the cycle of signal source, as shown in the image below:
3.
3.
3.
3. Example
Example
Example
Example Three
Three
Three
Three : Save
Save
Save
Save waveform
waveform
waveform
waveform image
image
image
image
Sometimes waveform images need to be archived or analyzed on PC platform.
Please operate according to following steps:
� Use “ ▲ ” or “ ▼ ” to choose the Fn items in Measurement Area, press “ M ” , use “ ◄ ” or “ ► ” to choose Save
Bmp , and then use “ ◄ ” or “ ► ” to choose the file name on the lower right corner of the screen ,e.g.Save000.BMP
,
as shown in the image; and then press “ � || ” to save it to the built-in U disk.
� Just copy the image to your PC, and you can analyze the waveform
V1
V2