11
9. The symbol for the data read-out appears when data is sent to the
meter or when the meter sends data to the PC.
10. The symbol for the clock control shows if the tari control of the
meter is controlled by the internal clock.
11. The tari information shows the currently active energy tari or
the maximum tari.
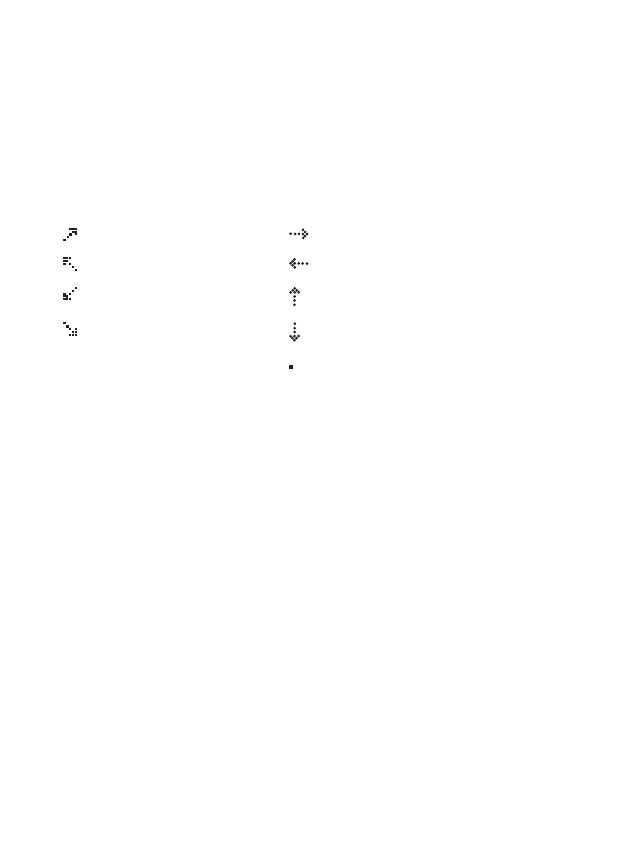
12. The quadrant information shows in which quadrant, depending on
the lead, is measured at the moment
1
st
quadrant +P/+Q +P, no load Q
2
nd
quadrant –P/+Q –P, no load Q
3
rd
quadrant –P/–Q no load P, +Q
4
th
quadrant +P/–Q no load P, –Q
no load P, Q
13. The phase indicator signalises the connection with the individual
phase voltages. Possible displays are:
L1 L1 available L13 L1, L3 available
L2 L2 available L23 L2, L3 available
L3 L3 available L123 L1, L2, L3 available
L12 L1, L2 available L123 ashing: L1, L2, L3
available, rotating eld is
counter-clockwise
14. The tab display indicates which tab the displayed value comes from.
15. In the code number area the measured values are dened by
reference to the OBIS code.
 Loading...