RHT10 HW_SW-en-US_V5.6.2 6/16
9
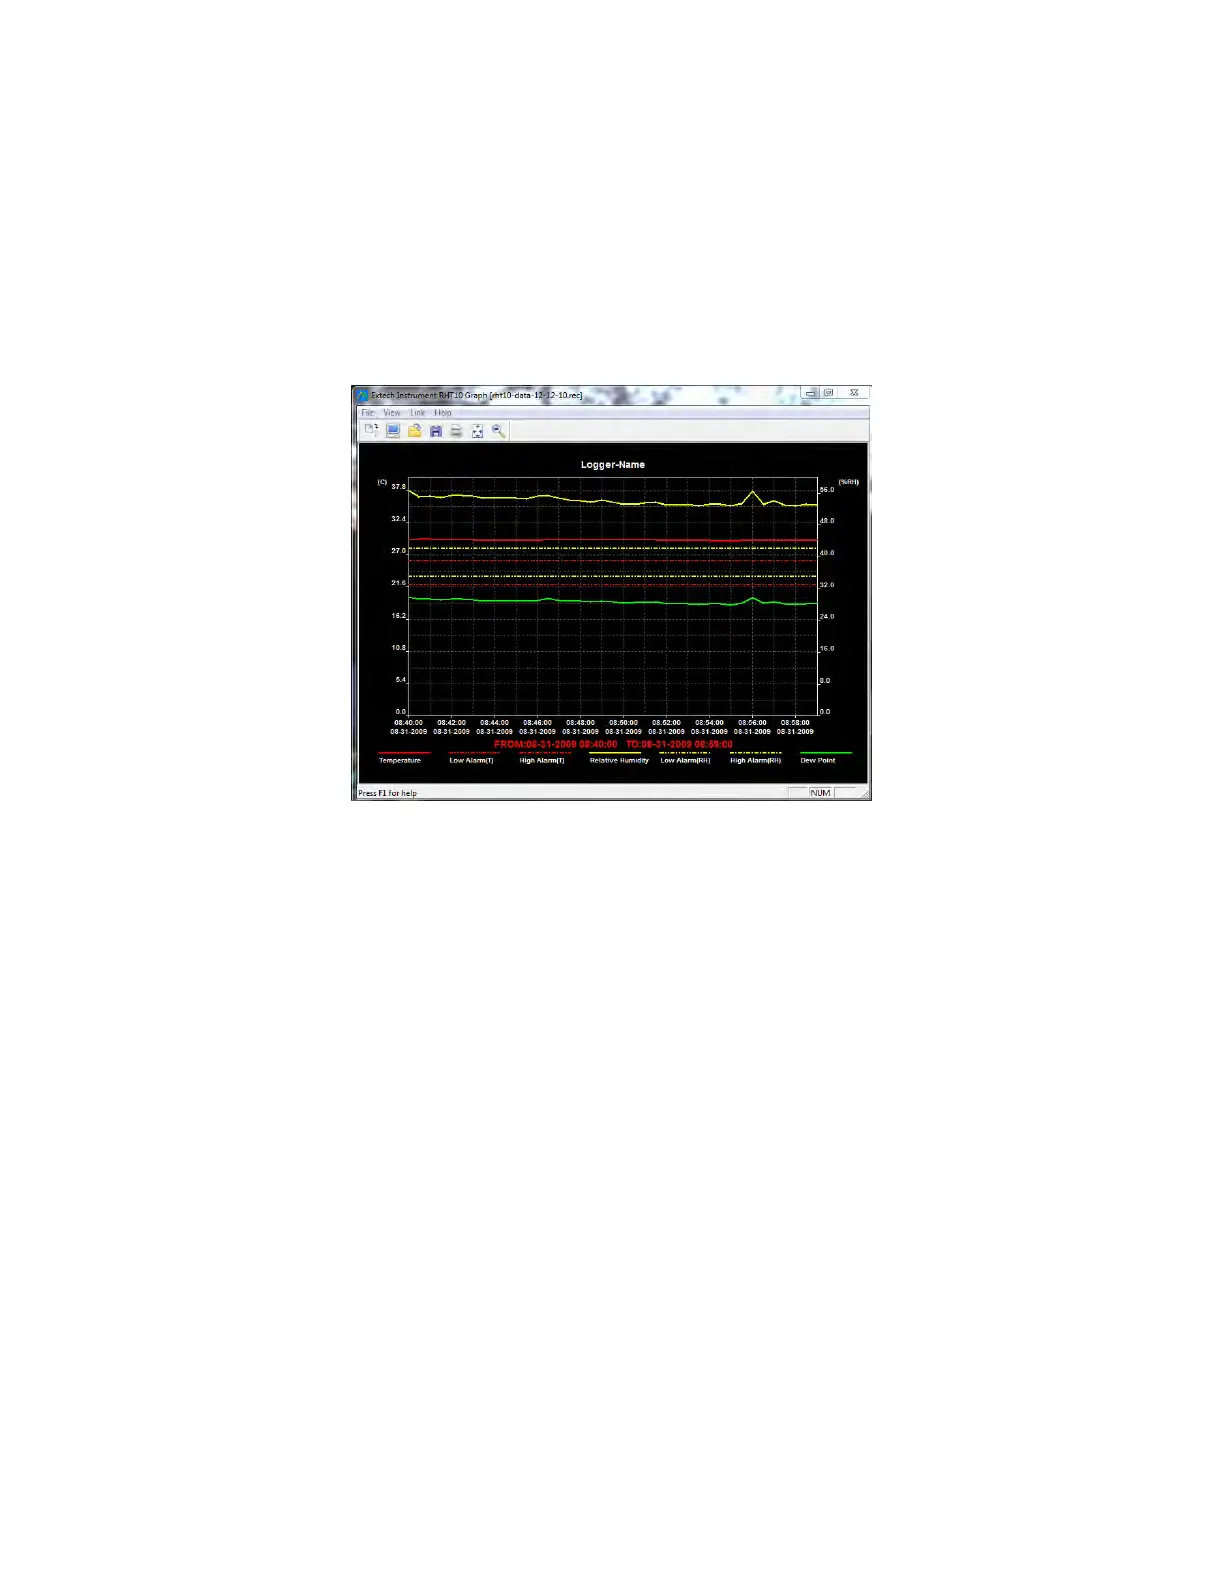
WhenVIEWispressed,theDataGraphwindowappears,
The Data Graph window presents the transferred data in an x‐y graph format with Date/Time
representedonthe horizontalaxisandTemperature/ RelativeHumidity /DewPoint/Grains per
poundGPP(withoptionalRHT10‐SWonly)/AlarmLimitsrepresentedonthever
ticalaxis:
Tozoominandoutofdataregions,thereareseveralapproaches:
1. Usethemousetoclickanddraga boxaroundanydataareatomagnifytheselected
area.
2. Clickonthezoommagnifiericontoolonthemenubar
3. SelectVIEWALLorZOOMOUTfromtheVIEWpu
ll‐downmenu.
In the example graph above, the Temperature is represented by the solid red line (the lines are
known as ‘traces’); the RH and Dew Point are represented by the solid yellow and green lines,
respectively. The low and high alarm values for temperature are represented by the das
hed red
traces;thecorrespondingalarmsforhumidityarerepresentedbythedashedyellowtraces.
www.GlobalTestSupply.com
Find Quality Products Online at: sales@GlobalTestSupply.com