TH10 V1.0 9/07
7
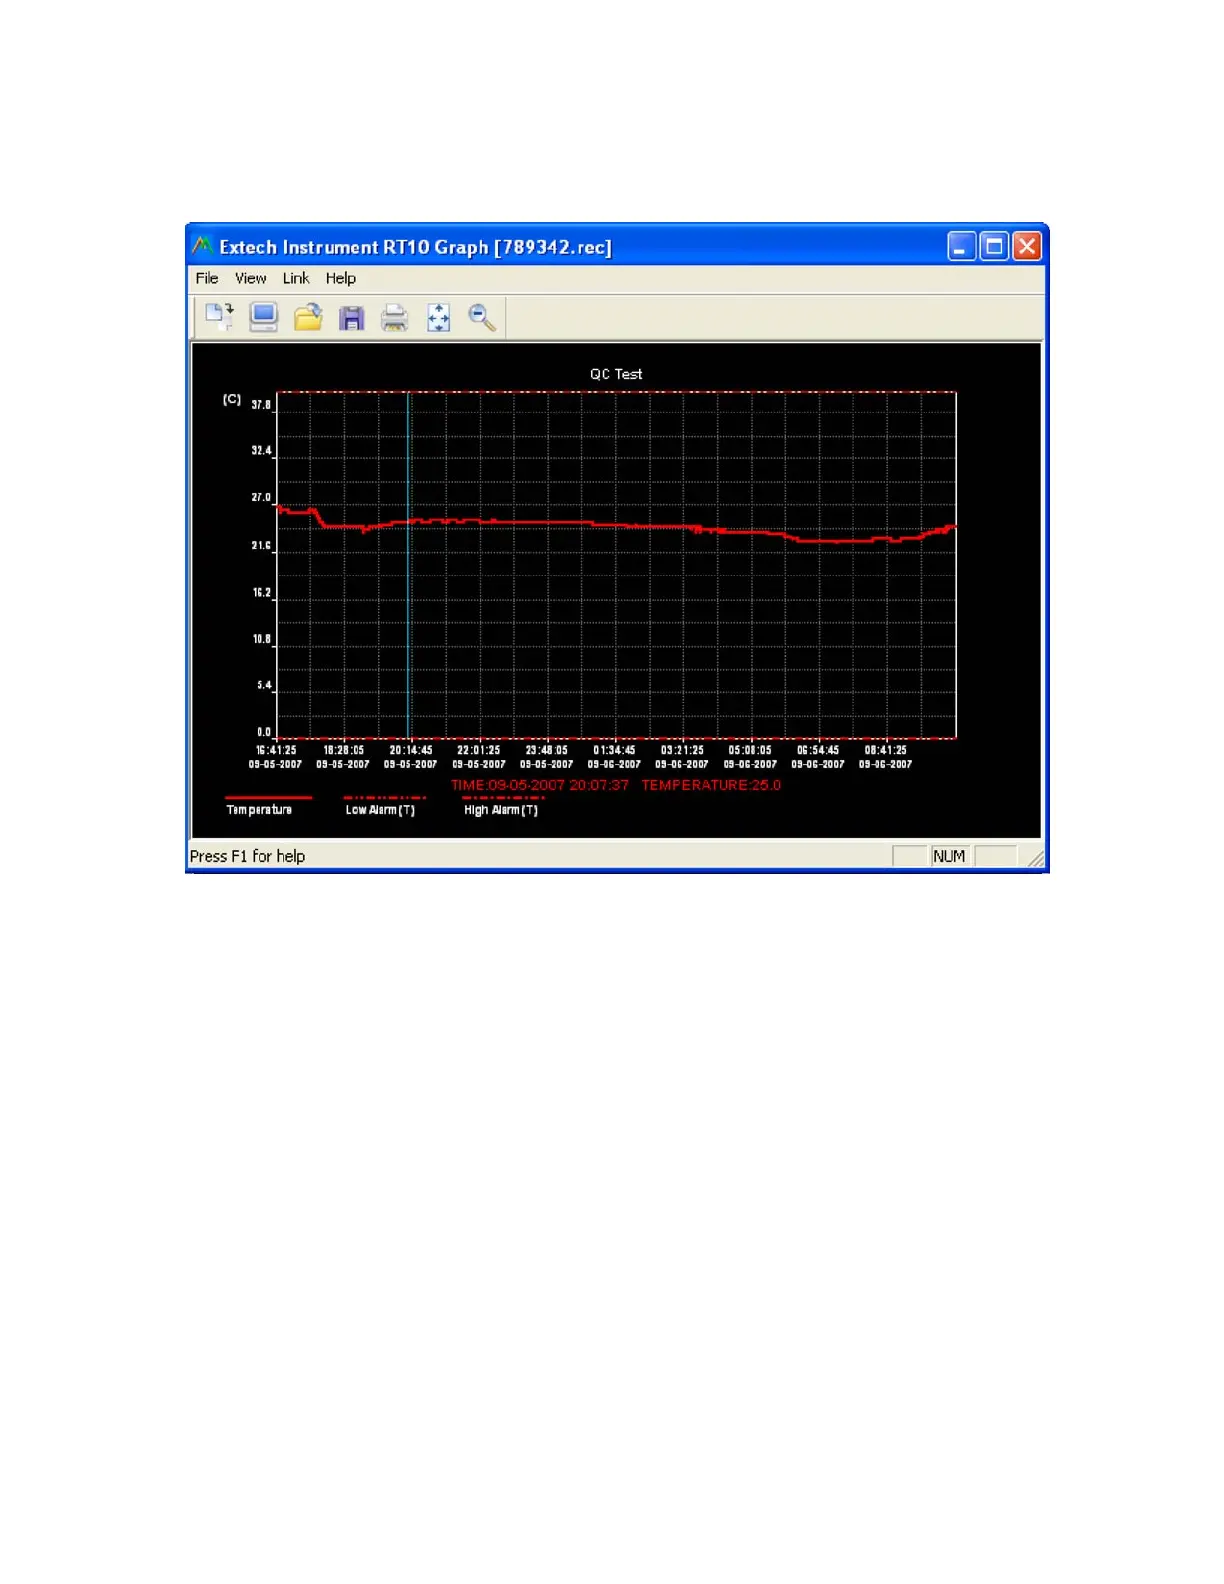
When VIEW is pressed, the Data Graph window appears
The Data Graph window presents the transferred data in an x-y graph format with Date/Time represented on the
horizontal axis and Alarm Limits represented on the vertical axis:
To zoom in and out of data regions, there are several approaches:
1) Use the mouse to click and drag a box around any data area to magnify the selected area.
2) Click on the zoom magnifier icon tool on the menu bar
3) Select VIEW ALL or ZOOM OUT from the VIEW pull-down menu.
In the example graph above, the Temperature is represented by the solid red line (the lines are known as ‘traces’). The low
and high alarm values for temperature are represented by the dashed red trace.
To customize the graph window select SHOW TRACES, BACKGROUND, GRID LINES, and MASK POINTS from the
VIEW pull-down menu. These options provide the following features:
SHOW TRACES: Allows the user to select which data to view as a trace (Temperature & Alarms).
BACKGROUND: Select background color scheme.
GRID LINES: Add or remove grid lines from x and y axes.
MASK POINTS: Places dots on the traces for the actual data points, breaking up the continuous nature of a trace.