14
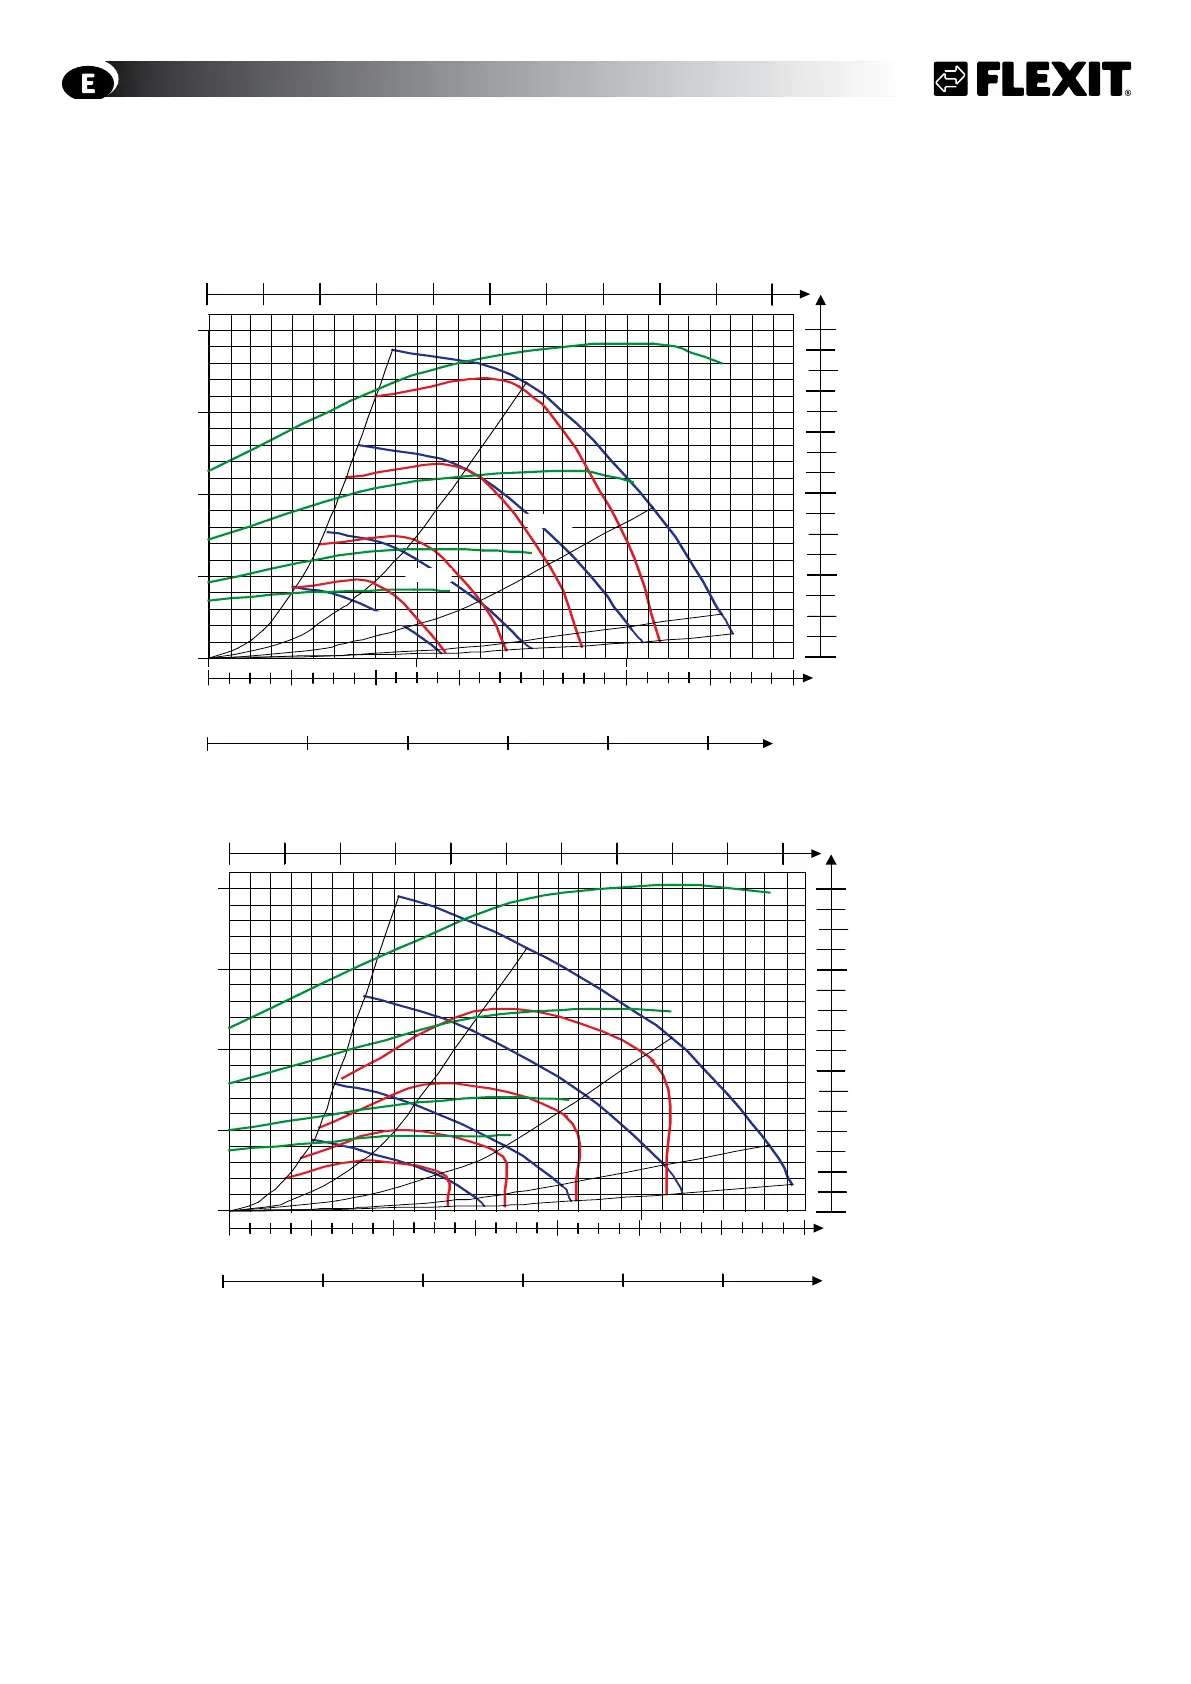
7.3 Capacity Diagram, Sound Data, Specifications - Flexit L20 X W/E
Supply air side (with F7 filter)
Data for supply air is measured in accordance with ISO 5136,
the “In duct method”.
Radiated noise is measured in accordance with ISO 9614-2.
Bruel & Kjær measuring equipment, type 2260.
Blue curves: Air capacity at various capacity settings in Volt.
Green curves: Supply air fan power consumption at various capacity
settings.
Red curves: Sound power level Lw
A, cf. correction table.
Light blue correction axis: Pressure increase using an EU-5 filter.
Light green correction axis: Pressure reduction using a water battery.
Sound data is given at sound power level LwA in the
capacity diagrams and is corrected with the table below
for the various octave bands. Radiated noise produces
Lw in the various octave bands and total LwA. This is read
directly from the supply air table.
Correction factor for LwA
Hz 63 125 250 500 1000 2000 4000 8000 LwA
Supply air 2 -9 -1 -3 -4 -9 -17 -28
Extract air 20 6 -7 -1 -17 -24 -34 -43
Radiated -40 -40 -33 -31 -28 -29 -33 -49 -23,6
Extract air side (with F7 filter)
Power consumption in Watt
Contact resistance (Pa)
Air flow rate, m
3
/h - Pressure correction factor
Power consumption in Watt
Contact resistance (Pa)
Air flow rate, m
3
/h - Pressure correction factor
0
200
400
600
800
Pa
Pa
5 15 30
40
50
0
W
l/s
0
150 300
450
600
0 800 1600
2400
m
3
/h
400 1200
2000
0
Water Battery
F5-filter
-1 -5 -10 -15 -20
0
200
400
600
800
84dB(A)
Max
80dB(A)
75dB( A
)
Max
80%
60%
70dB(A)
40%
80%
60%
40%
28 0 0
750
60dB(A)
50dB(A)
45dB(A)
Max
80%
40%
60%
55dB(A)
l/s
0
150 300
450
600
0 800 1600
2400
m
3
/h
400 1200
2000
0 W
200
400
600
800
2800
0
200
400
600
Pa
Pa
5
15
30
40
50
0
800
750
Max
80%
40%
60%
F5-filter