50
Appendix C
Planck’s Law
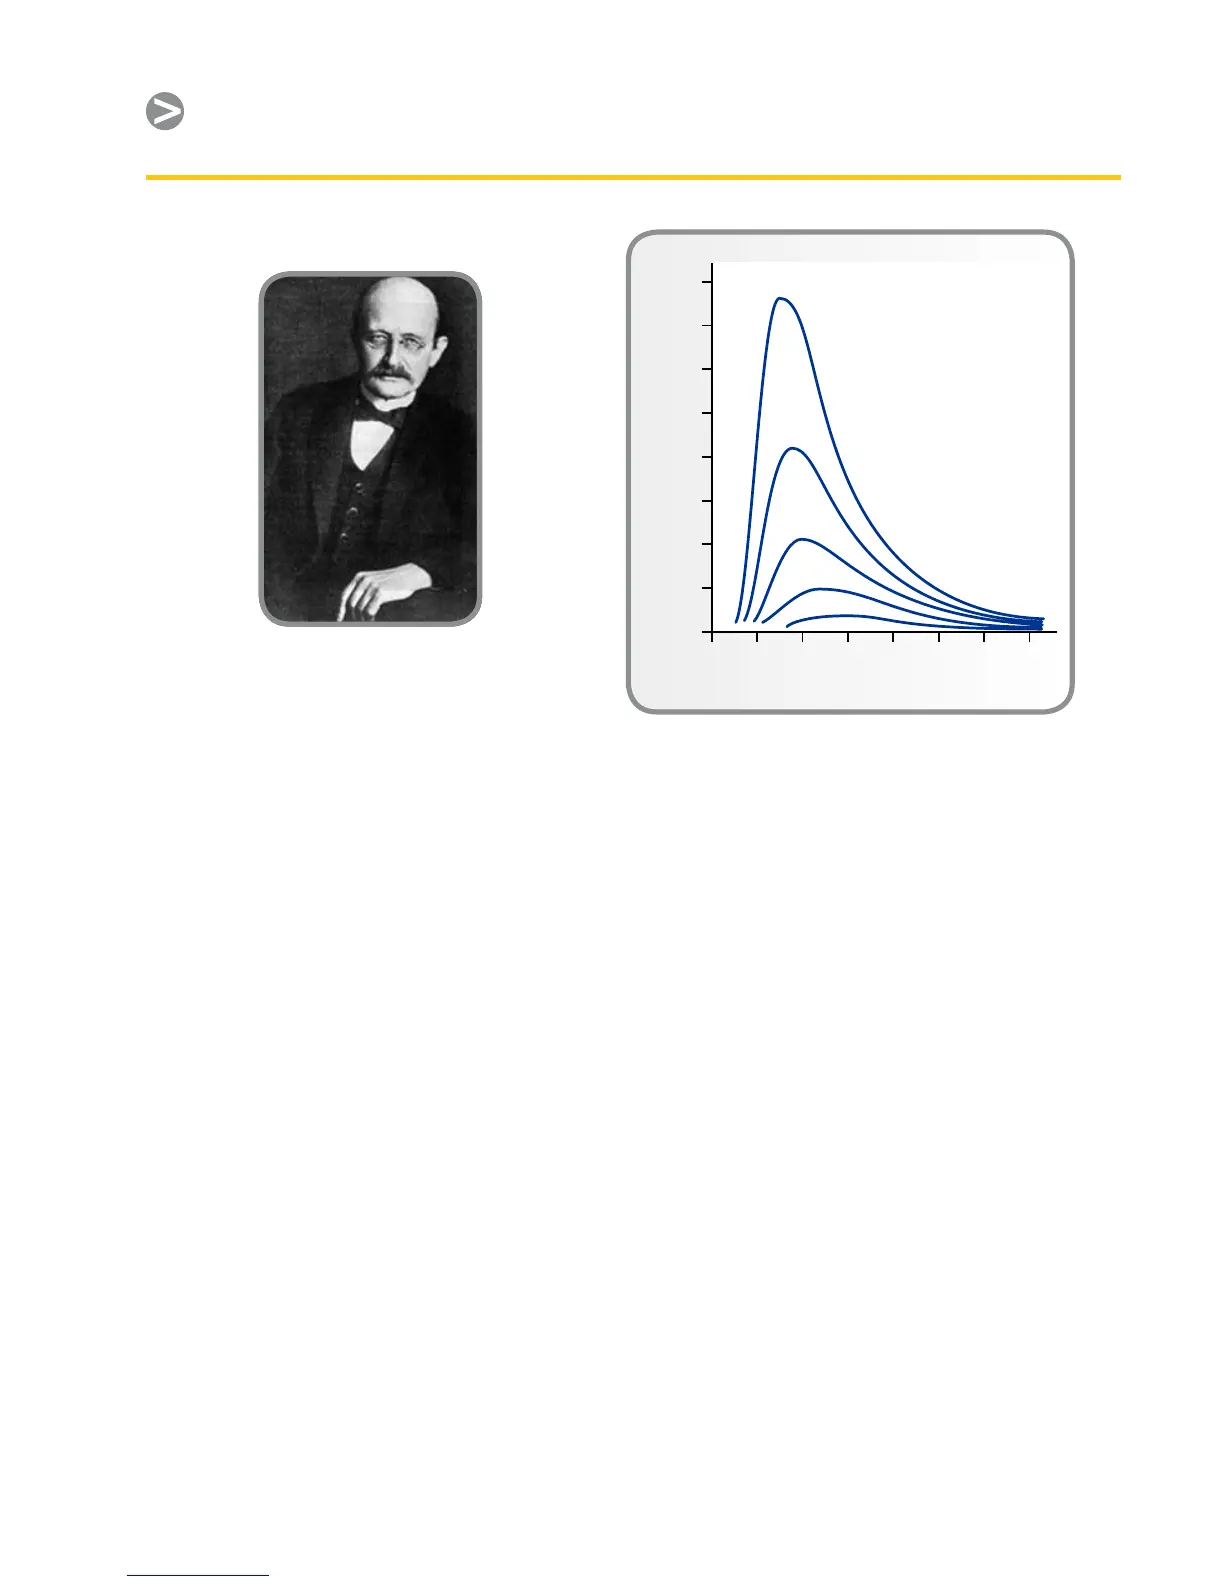
Figure 7. Max Planck (1858–1947)
Max Planck (Figure 7) was able to describe
the spectral distribution of the radiation
from a blackbody by means of the
following formula:
πhc
3
W
λb
=
_______________
× 10
–6
[Watt/m
µ m ]
λ
(e
hc/λkT
– 1)
where:
W
λb
Blackbody spectral radiant emittance
at wavelength
λb
c Velocity of light = 3 × 10
8
m/s
h Planck’s constant = 6.6 × 10
–34
Joule
sec
k Boltzmann’s constant = 1.4 × 10
–23
Joule/K
T Absolute temperature (K) of a
blackbody
λ Wavelength (µm)
The factor 10
–6
is used since spectral
emittance in the curves is expressed in
Watt/m
m. If the factor is excluded, the
dimension will be Watt/m
µm.
Planck’s formula, when plotted
graphically for various temperatures,
produces a family of curves. Following
any particular Planck curve, the spectral
emittance is zero at λ = 0, then increases
rapidly to a maximum at a wavelength
µmax and after passing it approaches
zero again at very long wavelengths. The
higher the temperature, the shorter the
wavelength at which maximum occurs.
See Figure 8.
Wien’s Displacement Law
By dierentiating Planck’s formula with
respect to λ and nding the maximum,
we have:
2898
λ
max
=
______
[µm]
T
This is Wien’s formula (after Wilhelm
Wien, shown in Figure 9), which expresses
mathematically the common observation
that colors vary from red to orange or
yellow as the temperature of a thermal
radiator increases (Figure 10). The
wavelength of the color is the same as