Energy Logger
Function Selection Buttons
37
Energy costs
Enter the costs/kWh for demand energy. The energy costs are applied
to forward energy (positive energy) using the demand interval and can
be reviewed in the Logger detail screen Energy - Demand.
Energy costs can be entered using a resolution of 0.001. The currency
unit is changed in Instrument Settings. See Instrument Settings on
page 39 for more information.
Note
This value is not available for load studies.
Description
Enter more details about the measurement, such as customer,
location, and load-rating plate data with the virtual keyboard. This
description field is limited to 127 characters.
After you download a logging session with Energy Analyze software,
use more advanced inputs to support line breaks and up to
1000 characters.
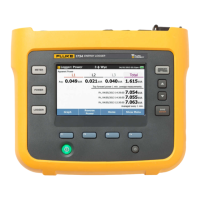
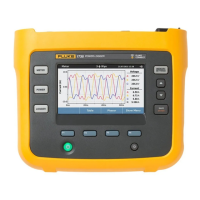
Logging Session Review
When a logging session is started, or when you review a completed
session, the Logging home screen is shown. During active recording,
push
to access this screen. It shows:
•
Overview chart with active power
•
PF for energy studies
•
Currents for load studies
Total energy is available in energy studies.
The screen updates with each new average calculation interval at a
maximum of every 5 seconds.
From the Logger home screen you have access to:
•
V, A, Hz, + (A, Hz, + for load studies)
•
Power
•
Energy
•
Session details
To prevent unwanted operation during a active logging session, touch
the Lock Screen target. See Screen Lock on page 42 for more
information.
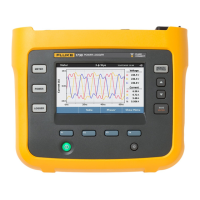
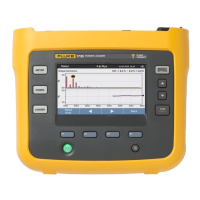
In the "V, A, Hz, +", "Power" and "Energy" screens, use (Show
Menu) or the cursor keys to see a list of available parameters. Use
/ to select a parameter and confirm the selection with .
Tables update with each new average calculation interval at a
maximum of every 5 seconds. Push
(Refresh) to update charts
on request.
V, A, Hz, + (Load studies: A, Hz, +)
You can determine the average value measured over the logging
duration as well as minimum/maximum values with high resolution.
Note
+ available with the Logger and the PC software
0 available with the PC software
Parameter Min Max Resolution
A++
Siding half cycle
(typical 20 ms @ 50 Hz, 16.7 ms
@ 60 Hz)
V0+
Siding half cycle
(typical 10 ms @ 50 Hz, 8.3 ms
@ 60 Hz)
Hz + +
200 ms
AUX + +
200 ms
THD-V/THD-A 0 +
200 ms