Do you have a question about the Fluke 434-II and is the answer not in the manual?
Details warranty terms, limitations, and exclusion clauses for the product and accessories.
Lists items included in the analyzer kit and notes about battery charging status.
Provides contact information and methods for locating authorized Fluke service centers.
Crucial safety instructions, warnings, cautions, and international symbols for analyzer use.
Guidelines for safe handling, storage, charging, and disposal of the Li-ion battery pack.
Explains basic measurement concepts and the use of scope waveform for connection checks.
Overviews various measurement modes for detailed power system analysis, e.g., Harmonics, Flicker, Dips & Swells.
Details how to log and save measurement values from meter screens, including adjustable average time and duration.
Describes the use of the analyzer's tilt stand for viewing and attaching the hang strap.
Instructions on powering the analyzer using the battery or AC adapter, including battery condition indicators.
Step-by-step guide for installing or replacing the analyzer's battery pack, with safety warnings.
Information on using the SD memory card for data storage and handling precautions, including avoiding touching contacts.
Guides the user through initial settings like language, frequency, voltage, and date/time upon first use.
Instructions on adjusting the backlight brightness for better visibility and saving battery power.
Explains how to lock the keyboard to prevent unintended operation during unattended measurements.
Details how to navigate through the analyzer's menus using arrow and function keys for selections.
Guidance on adjusting the display contrast to personal preference via the setup menu.
Procedures for resetting analyzer settings to factory defaults, including initial setups and limits.
Explains how measurement results are color-coded for different phases and how to select phase colors.
Describes the purpose and usage of different screen types like Meter, Trend, Waveform, Phasor, Bar Graph, and Events list.
Details common screen elements like measuring mode, values, status indicators, and softkey text area.
Explains how to connect voltage and current probes to the analyzer using BNC and banana inputs.
Details the oscilloscope-style display of voltage and current waveforms, including rms values and cursor functionality.
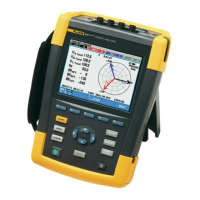
Describes the vector diagram display of phase relations between voltages and currents, including numerical values.
Provides advice on interpreting waveform shapes, checking connections, and understanding phase relationships.
Displays numerical values for voltages, currents, frequency, and Crest Factor, indicating distortion levels.
Shows the changes over time of values displayed in the Meter screen, allowing analysis of trends.
Lists threshold crossings of phase voltages, including start time, duration, and magnitude of events.
Offers guidance on checking voltage/frequency, motor balance, and interpreting Crest Factor for distortion.
Displays recorded voltage and current trends to analyze cause and effect of deviations like dips and swells.
Lists threshold crossings for voltage dips, swells, interruptions, and rapid voltage changes with event details.
Provides insights into identifying weak power systems and troubleshooting dips/swells by monitoring trends.
Shows the percentage contribution of harmonic components to the full signal, indicating distortion levels.
Displays harmonic measurements grouped by phase, including THD and K-factor.
Illustrates how harmonics and related parameters vary over time, allowing trend analysis.
Explains positive/negative sequence harmonics effects on motors and zero sequence current issues.
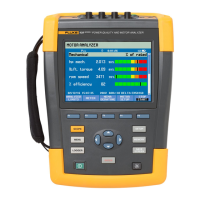
Displays key power parameters like Real, Apparent, and Reactive Power, as well as energy usage.
Shows the changes over time of power and energy measurements, useful for analyzing usage patterns.
Discusses power factor interpretation, inductive loads, and troubleshooting power systems for efficiency.
Presents results of energy loss calculations due to resistance, reactive power, unbalance, and harmonics.
Shows detailed energy loss measurements per phase and in total, including cost estimations.
Offers advice on optimizing power system utilization, improving power factor, and reducing energy losses.
Displays DC and AC measurements for inverter efficiency, including Wac, Wfund, Wdc, and Efficiency percentage.
Shows the trend of inverter efficiency and related parameters over time, aiding in performance analysis.
Provides guidance on evaluating inverter performance, considering factors like efficiency percentage and cabling.
Displays phase relations between voltages and currents in a vector diagram, highlighting unbalance conditions.
Shows numerical values for negative and zero sequence voltage/current unbalance, phase angles, and frequency.
Tracks unbalance parameters over time, allowing analysis of their stability and trends.
Explains effects of voltage and current unbalance on motors and the significance of positive, negative, and zero sequence components.
Captures and displays surge currents occurring at load startup, showing pretrigger and duration.
Advises on checking peak currents, their duration, and setting circuit breaker trip levels based on inrush measurements.
Displays power quality parameters like RMS voltages, Harmonics, Flicker, Dips/Swells, and Unbalance in bar graphs.
Shows changes over time for power quality parameters, allowing analysis of trends and potential issues.
Lists power quality events that occurred during measurement, including date, time, phase, and duration.
Visualizes time spent within limits for harmonics and THD, indicating compliance with standards.
Suggests using Monitor for long-term quality checks and other functions for troubleshooting specific issues.
Quantifies luminance fluctuation caused by voltage variations, showing Pinst, Pst, and Plt values.
Displays changes over time for flicker parameters and related data like half-cycle rms voltage.
Guides on using flicker trends to find sources of flicker and understanding Pst and Plt measurement periods.
Captures high-resolution voltage and current waveforms during disturbances like dips, swells, and interruptions.
Explains how transients can cause equipment malfunctions and suggests monitoring for intermittent events.
Functions as an 8-channel scope recorder, capturing high-resolution waveforms and power data.
Displays half-cycle rms values for voltage, current, frequency, and instantaneous power measurements.
Allows viewing recorded waveforms and analyzing specific segments of interest using cursors.
Suggests monitoring waveforms for sudden load changes and identifying weak power distribution systems.
Shows the occurrence and level of control signals over time, used for remote appliance control.
Lists detected mains signaling events, including date, time, type, level, and duration of the signal.
Emphasizes knowing control signal frequencies in advance and programming limits according to standards.
Allows selection of interval time, readings to log, duration, and start mode for data logging.
Displays current logged readings from the logger function, allowing scrolling through all recorded data.
Visualizes logged data trends over time, enabling analysis of recorded measurements.
Lists logged events based on threshold crossings, providing details about detected occurrences.
Displays numerical measurements relevant for shipboard installations, complying with MIL-STD-1399-300B.
Shows changes over time for shipboard V/A/Hz measurements, useful for monitoring system stability.
Lists events related to shipboard V/A/Hz measurements, such as dips and swells.
Explains how to use the cursor to pinpoint specific points on waveform displays and view corresponding values.
Details how to use the cursor on trend graphs to examine specific data points and their associated values.
Describes transitioning from an event table to a trend display with the cursor positioned on a highlighted event.
Explains how to use the cursor on bar graphs to view measurement data for individual bars or components.
Guides initial configuration of language, frequency, voltage, date, and time settings for the analyzer.
Covers customization of display settings, language, phase identification, RS-232, and factory reset options.
Allows detailed customization of measurement parameters, wiring configurations, scales, and function preferences.
Enables saving, recalling, and defining limits for power quality monitoring and event capture levels.
Explains the types of data that can be stored in the analyzer's memory, including limits, tasks, and measurements.
Describes how to capture and save screenshots of the analyzer's display for documentation purposes.
Details how to save, recall, view, delete, and rename datasets and screenshots using the memory function.
Guides on connecting the analyzer to a PC via USB for data transfer and software interaction.
Provides instructions for cleaning the analyzer and accessories safely using a damp cloth and mild soap.
Recommends charging the battery to about 50% before storing the analyzer for extended periods.
Advises on maintaining battery health through full discharge/charge cycles and checking battery condition indicators.
Explains how to access the menu for installing optional features and checking the last calibration date.
Lists user-replaceable parts and optional accessories available for the analyzer.
Offers solutions for common issues like the analyzer not starting up or the screen remaining black.
Lists the Fluke analyzer models covered in the manual, including their primary functions.
Outlines performance guarantees, accuracy statements, and calibration cycle information for the instrument.
Provides information on environmental conditions affecting the analyzer's operation and specifications.
Details safety standards compliance and emphasizes following manual instructions for safe operation.
Lists detailed electrical measurement specifications, including voltage and current input characteristics.
Describes the power measurement and energy loss calculation methods used by the Fluke 430 Series II instruments.
Provides step-by-step instructions for installing the necessary USB drivers for PC communication.
Outlines procedures for managing instrument memory, including data erasure and security measures.
| Model | Fluke 434-II |
|---|---|
| Type | Power Quality Analyzer |
| Power Quality Compliance | IEC61000-4-30 Class A |
| Voltage AC | 1000 V |
| Voltage DC | 1000 V |
| Harmonics | Up to 50th harmonic |
| Display | LCD |
| Connectivity | USB |
| Weight | 1.5 kg |
| Frequency | 42.5 Hz to 69 Hz |