20/65
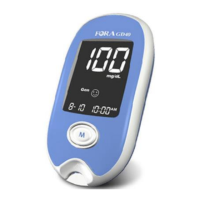
7. FORA ADVANCED pro Blood Glucose, Hematocrit and Hemoglobin Test Strip
(1) BG
Accuracy
The table below displays how often FORA achieves this target. The chart is
based on a study carried out on 160 patients (each patient was tested six times
which had 960 test results) to see how well FORA performed compared to YSI-
2300 reference method results.
Table 1 Accuracy results for glucose concentration < 100 mg/dL (5.55 mmol/L)
Within ±5 mg/dL
(Within ±0.28mmol/L)
Within ±10 mg/dL
(Within ±0.55mmol/L)
Within ±15 mg/dL*
(Within ± 0.83 mmol/L)
Table 2 Accuracy results for glucose concentration≧100 mg/dL (5.55 mmol/L)
Table 3 Accuracy results for glucose concentrations between 40.3 mg/dL
(2.24mmol/L ) to 547.0mg/dL (30.39mmol/L)
Within ±15 mg/dL or ±15%
(Within ±0.83 mmol/L or ±15%)
Note: *According to the accuracy criteria of EN ISO 15197: 2015, 95% of all
differences in glucose values (i.e., YSI-2300 reference values minus glucose
values of FORA) should be within ±15 mg/dL (0.83 mmol/L) for glucose
concentration < 100 mg/dL (5.55 mmol/L), and within ±15% for glucose
concentration ≥ 100 mg/dL (5.55 mmol/L). When Test Strips results are compared
to the reference values, difference values below 100 mg/dL (5.55 mmol/L) are
expressed in mg/dL or mmol/L, while those above 100 mg/dL (5.55 mmol/L) in
percentage.
User performance
160 subjects were tested with blood samples taken from the fingertip. The tables
show how well FORA performed compared to YSI-2300 reference method results.