16
2.4.4. Printing a Table
The displayed data can also be printed as a table. The printed table will include data
from all MicroLite’s that are currently represented on the graph (to learn how to add or
remove data sets from the graph, refer to page 16) as well as the MicroLite name, serial
number and the alarm level setup. Data that exceeds any of the alarm levels will be
highlighted by arrows.
1. Click Print on the main toolbar to open the Print Options dialog box.
2. Click the Table option.
3. If you want to print only part of the data, uncheck the check box and select the
desired time and date in the From and To boxes.
4. Click Print to open the Print dialog box and click OK.
2.5. Viewing the Data
2.5.1. Display Options
MicroLab Lite’s main window consists of three parts: the graph, the table and the Data
Map. You can display all three parts simultaneously (the default view) or any
combination of them.
Graph
Click Graph to display or remove the graph. The graph displays the data sets
plotted vs. time.
In order to keep the graph clear and simple, only two Y-axes can be shown on the graph
simultaneously. If there are three curves in the graph, one of the Y-axes will be hidden.
To make this axis visible, select the corresponding plot with the cursor (refer to page 17).
You can identify the Y-axis by its color, which matches the plot color.
Table
Click Table to display or remove the table.
The data in the table always matches the data that is currently displayed on the graph.
Data Map
Click Data Map to display or remove the Data Map.
The Data Map is a separate window that displays the list of data sets that were
downloaded or opened in the current session. Use the Data Map to navigate through the
available plots and to keep track of the data that is displayed in the graph and/or table
windows.
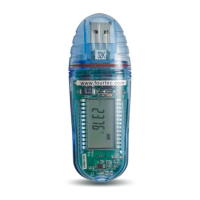
When you double-click on a MicroLite icon in the Data Map, MicroLab Lite jumps to the
corresponding data and displays it in the graph and table windows. It also expands the
Data Map to show the Temperature sensor data set.
A graph icon indicates that the data set is currently being displayed. Double-click
on the icon to clear the data set from the display.
www.esis.com.au
Ph 02 9481 7420
Fax 02 9481 7267
esis.enq@esis.com.au