Performance and curves diagrams
Domestic air conditioner
11.Performence and curves diagrams
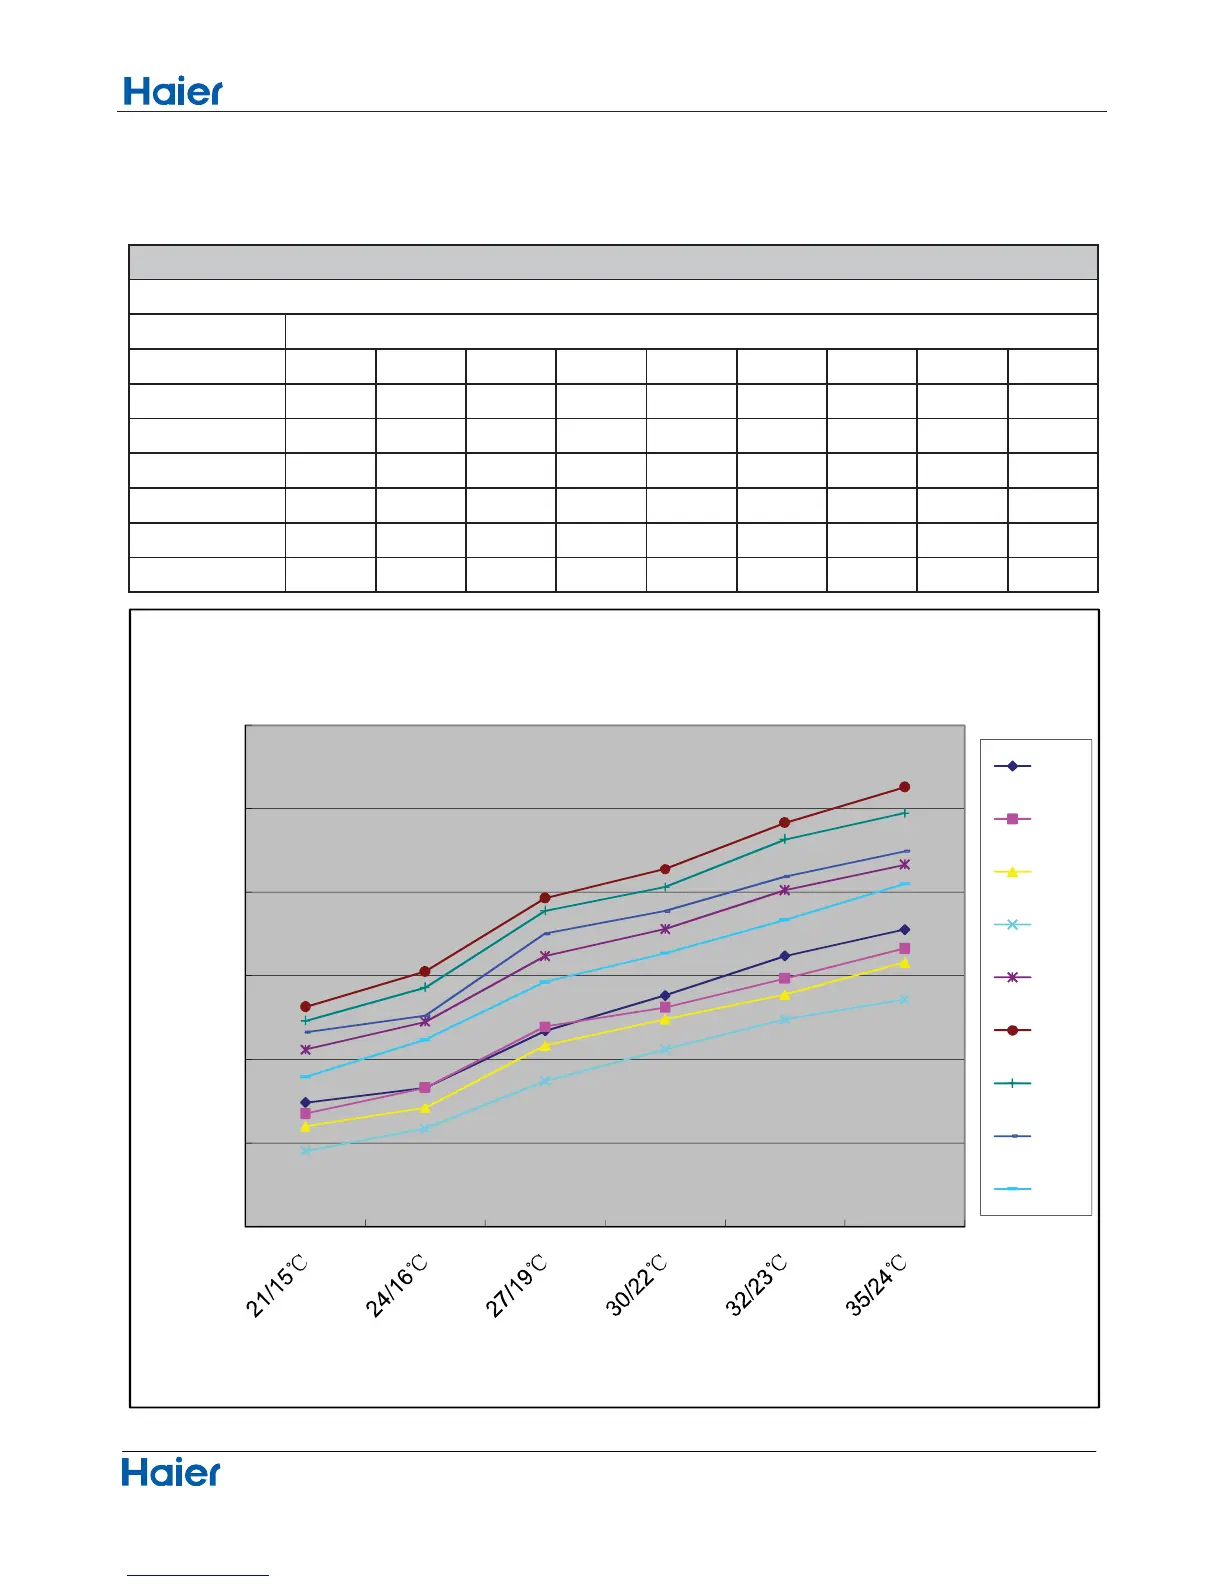
11.1 Cooling capacity-temperature curves
48
indoor temp.
DB/WB
10ć 15ć 20ć 25ć 30ć 35ć 38ć 40ć 43ć
21/15ć
2742 2676 2601 2454 3060 3315 3231 3164 2896
24/16ć
2832 2832 2712 2588 3226 3527 3431 3262 3120
27/19ć
3171 3198 3085 2870 3618 3965 3889 3754 3464
30/22ć
3384 3312 3240 3060 3780 4140 4032 3888 3636
32/23ć
3620 3486 3390 3241 4012 4417 4316 4096 3836
35/24ć
3778 3665 3581 3359 4166 4630 4475 4246 4052
cooling value-temerature table
performance curves
outdoor temp.
2000
2500
3000
3500
4000
4500
5000
cooling capacity (W)
cooling capacity and indoor/outdoor temp.curves
10ć
15ć
20ć
25ć
30ć
35ć
38ć
40ć
43ć
LQGRRUWHPS'%:%
 Loading...