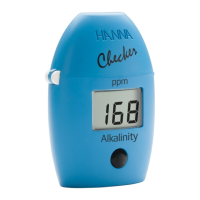
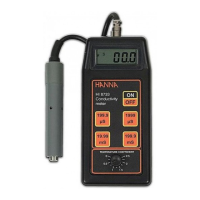
21
CONDUCTIVITY VERSUS
TEMPERATURE CHART
The conductivity of an aqueous solution is a measure of its ability to carry
an electrical current by means of ionic motion.
The conductivity invariably increases with increasing temperature.
It is affected by the type and number of ions in the solutions and by
the viscosity of the solution itself. Both parameters are temperature
dependent. The dependency of conductivity on temperature is expressed
as a relative change per Celsius degrees at a particular temperature, com‑
monly as %/ ºC. The following table lists the temperature dependence of
Hanna Instruments EC calibration buffers.
ºC ºF
HI7030
HI8030
(mS/cm)
HI7031
HI8031
(mS/cm)
HI7033
HI8033
(mS/cm)
HI7034
HI8034
(mS/cm)
HI7035
HI8035
(mS/cm)
HI7039
HI8039
(mS/cm)
0 32 7150 776 64 48300 65400 2760
5 41 8220 896 65 53500 74100 3180
10 50 9330 1020 67 59600 83200 3615
15 59 10480 1147 68 65400 92500 4063
16 60.8 10720 1173 70 67200 94400 4155
17 62.6 10950 1199 71 68500 96300 4245
18 64.4 11190 1225 73 69800 98200 4337
19 66.2 11430 1251 74 71300 100200 4429
20 68 11670 1278 76 72400 102100 4523
21 69.8 11910 1305 78 74000 104000 4617
22 71.6 12150 1332 79 75200 105900 4711
23 73.4 12390 1359 81 76500 107900 4805
24 75.2 12640 1386 82 78300 109800 4902
25 77 12880 1413 84 80000 111800 5000
26 78.8 13130 1440 86 81300 113800 5096
27 80.6 13370 1467 87 83000 115700 5190
28 82.4 13620 1494 89 84900 117700 5286
29 84.2 13870 1521 90 86300 119700 5383
30 86 14120 1548 92 88200 121800 5479
31 87.8 14370 1575 94 90000 123900 5575
 Loading...