51
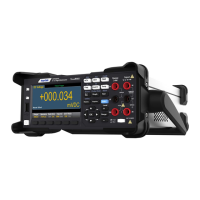
Even when the trend line moves out of the limit area, the boundary remains red.
When the trend line is within the limit, you can reset the boundary to green by
pressing Clear Condition.
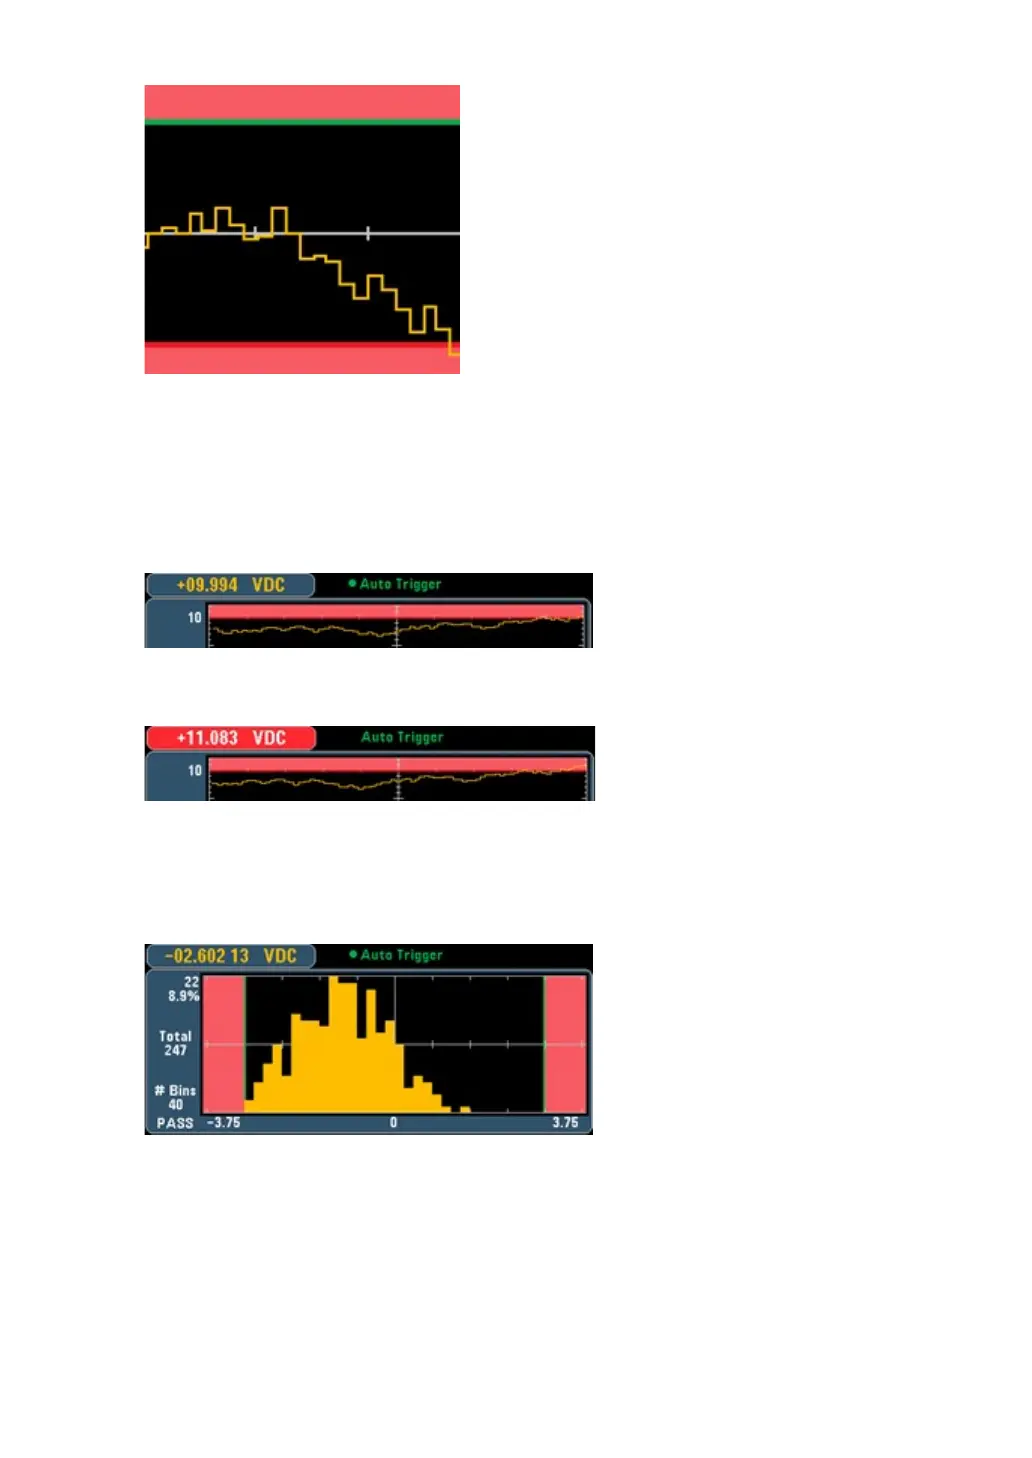
Also note that the newly displayed measured number (under +09.994 VDC) indicates
whether the measurement is within the limit. Because the limit is 10 V, the 9.994 VDC
value is displayed in the standard background.
In contrast, the 11.083 VDC reading is highlighted in red to indicate that it has
exceeded its limit.
Histogram
The same color scheme applies to histograms. In the image below, the green vertical
line separates the black histogram background from the pale red limit area, indicating
that the limit has not been exceeded.
In the image below, the low (left) limit boundary is red, indicating that the lower limit
has been exceeded. (The reading in the upper left corner (-01.68487VDC) is within
the limit, so it is not red).
 Loading...