MICROTSCM (07/09) Page 12
REV 2.4
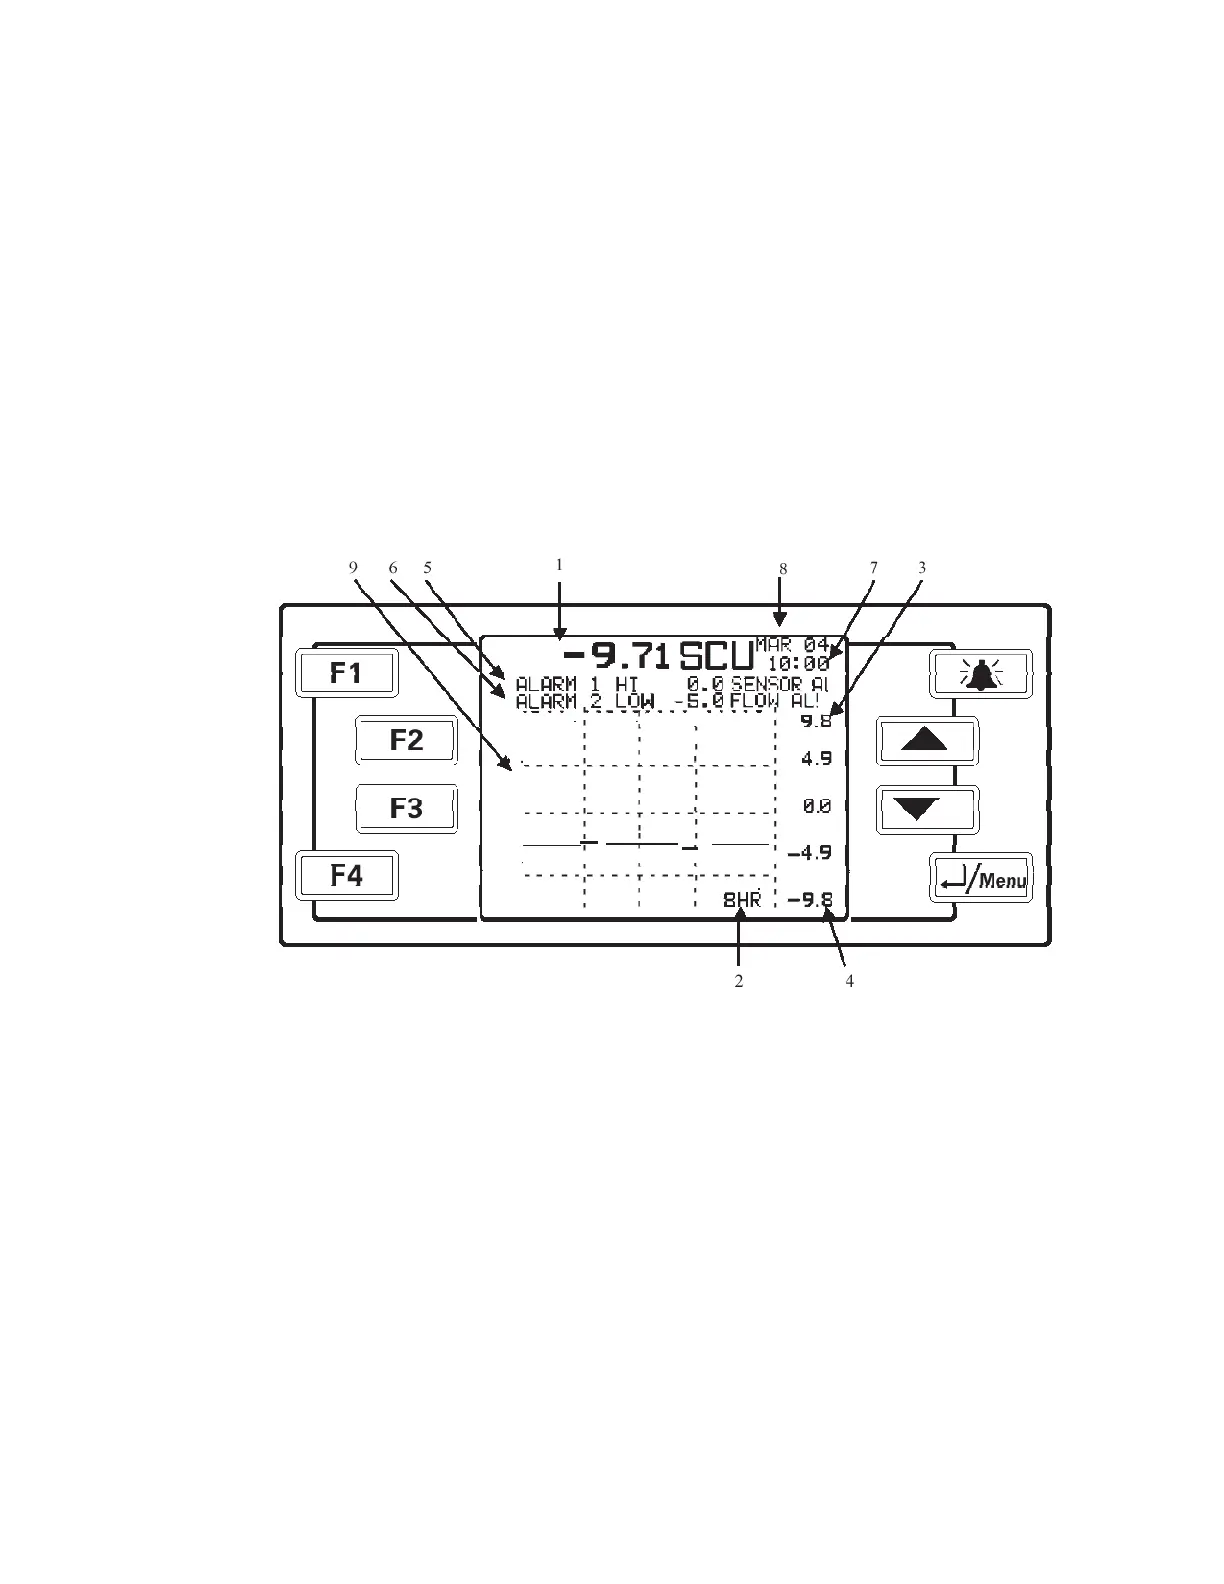
5.3 The Graphing Screen
Shown below in Figurer 7 is the main graphing screen. The numbers are used to identify
various features.
1. The larger number area shows the current reading and units used.
2. The graph time base. Options are 8 or 24 hours and can be set in the Display
Parameters Menu.
3 & 4. The upper and lower display limits. These are settable in the Display Parameters
Menu. Please note that these settings also affect the 4-20 mA /Voltage range.
5 & 6. Alarms 1&2. These can be set in the Alarms Setup Menu. These will flash on the
graphing screen if in an alarm condition.
7 & 8. Current time & date. This can be set in the Monitor Setup Menu.
9. Streaming current graph.
Figure 7: Analyzer Screen