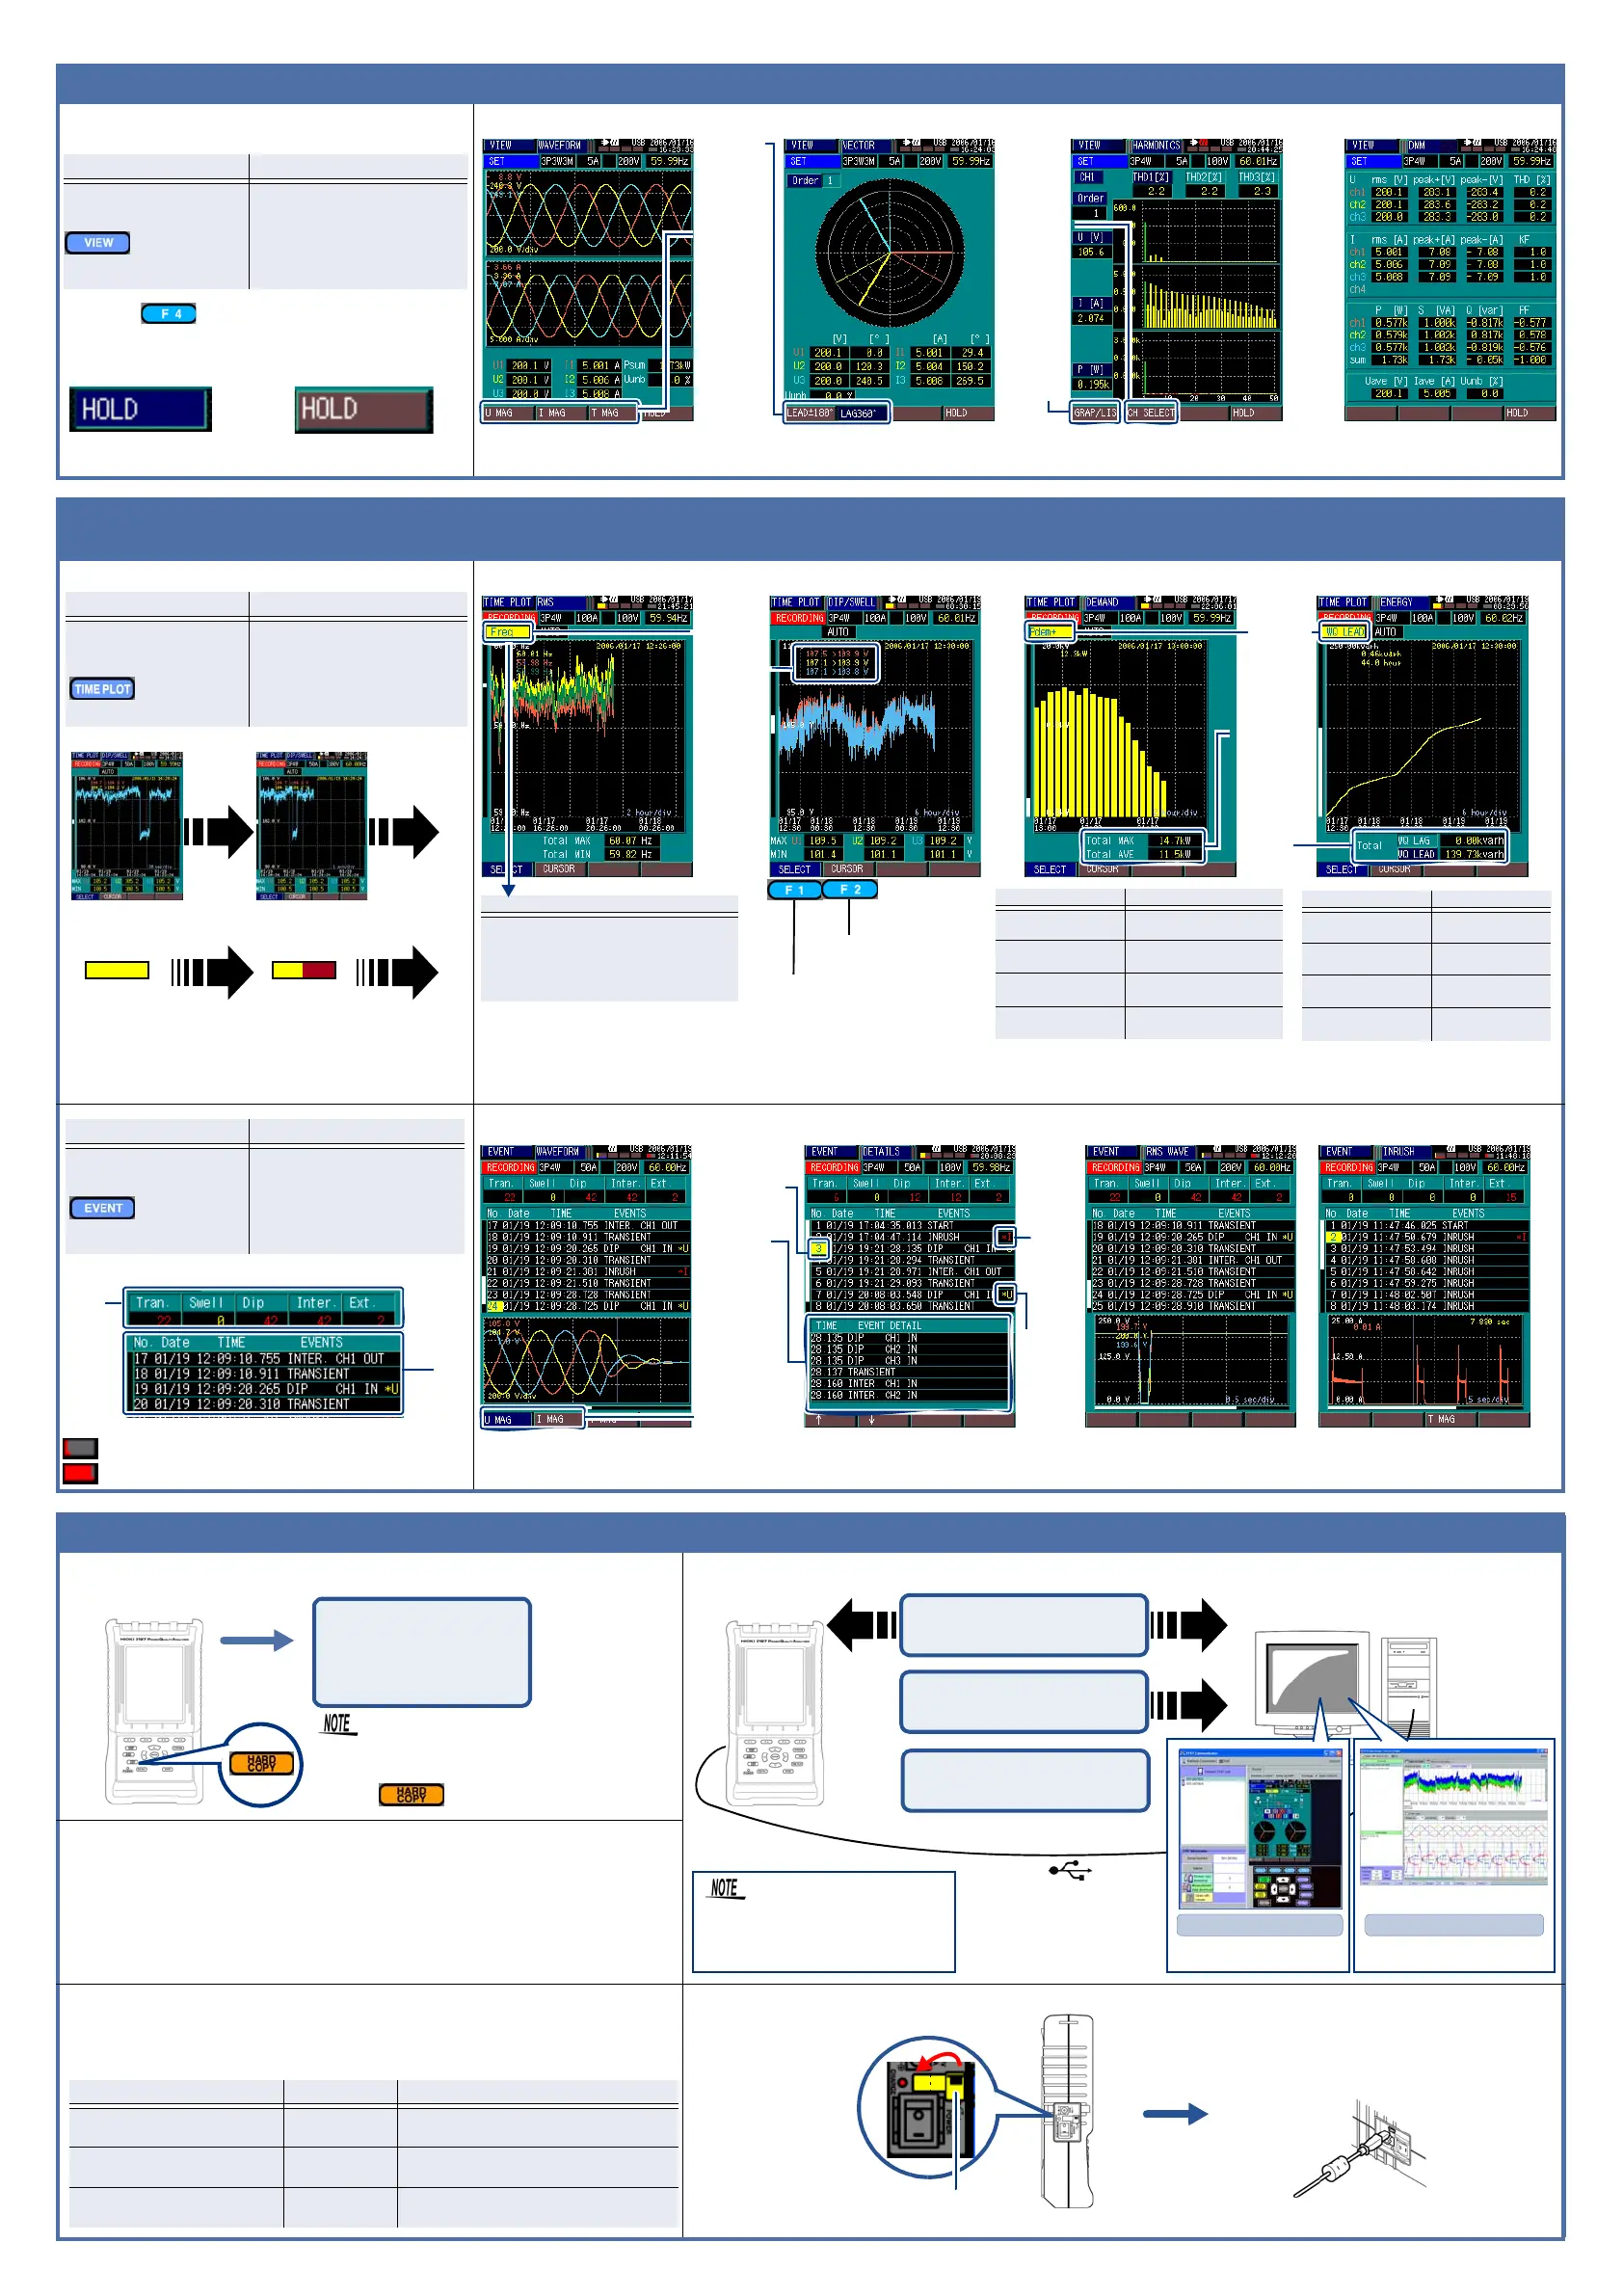
Step 4. Viewing Instantaneous Data
View instantaneous measurement conditions.
(Refreshed approx. every second.)
Press the key to hold the display.
(Press again to disable hold.)
Display Hold Display Hold disabled
Step 5. Viewing Recorded Measurement Data
(recorded measurement data is backed up even when the instrument's power is turned off)
Viewing measurement process and results
Updating the screen
Compressing internal memory
The time series graph displays within the screen at all times
each measurement result from recording start.
Event Recording Status Indicator
Step 6. Viewing Recorded Data (Measurement Data, Screen Image) on a Computer
Screen image
3197 Applications
(Install from the supplied CD.)
Measurement data (TIME PLOT data)
<Automatic data recording compression function>
This function begins recording at one-second intervals and automatically lengthens the
recording interval to up to an hour as internal memory fills. This function helps to ensure
that suitable data quantities are acquired for analysis, whether the overall measurement
period is short or long. This function supports continuous measurement sessions of up to
about 125 days.
Measurement data (EVENT data)
<Recordable Number of Events>
The number of events that can be recorded is as follows regardless of whether internal
memory is partitioned.
USB connection procedure
Screen Display Description
VIEW
[WAVEFORM ]
Displays instantaneous mea
surement values.
Measurement data can be
viewed at any time regardless
of recording start or stop state
[VECTOR]
[ HARMONICS]
[DMM]
Changes
magnification
rate for
waveform
display
WAVEFORM VECTOR HARMONICS DMM
Displays voltage
and
current waveforms.
Displays a voltage
and
current vector diagram.
Displays the results of harmonic wave-
form measurements of voltage, current,
and active power to the 50th order.
Displays the instantaneous voltage,
current, and power values for each
measurement channel.
Switches
phase
angle
display
Switches
between bar
graph and
numerical
value list
Switches
channels
Screen Display Description
TIME
PLOT
[RMS]
Displays data at each mea
surement interval as a time
series graph.
Shows fluctuations that occu
between recording start and
stop.
[DIP/SWELL]
[DEMAND]
[ENERGY]
Graph fills screen
Graph is compressed
Internal memory full Internal memory
compressed
RMS DIP/SWELL DEMAND ENERGY
Various calculated rms values are
displayed in a time series graph with
maximum, minimum, and average
values during every interval.
Displays calculated rms
voltage for one waveform
shifted by one-half cycle.
Displays demand values for
each specified demand period.
Energy consumption values of
active power [kWh] or reactive
power [kvarh] are displayed.
Changes
displayed
parameters
Displays U1,
U2, U3
voltage
fluctuation
Maximum/
average
value within
the period
Energy value
within the
period
Displayed Parameter
Freq, U1, I1, U2, I2, U3, I3, I4, U1peak+,
U1peak-, I1peak+, I1peak-, U2peak+,
U2peak-, I2peak+, I2peak-, U3peak+,
U3peak-, I3peak+, I3peak-, Uave, Iave,
Psum, Qsum, Ssum, PFsum, DPFsum,
THD1, THD2, THD3, Uunb
Selects cursor operation
Changes displayed parameters
Displayed Parameter Content
Pdem+
Active Power Demand
(consumption only)
Pdem-
Active Power Demand
(regenerated only)
QdemLAG
Reactive Power Demand
(lagging only)
QdemLEAD
Reactive Power Demand
(leading only)
Displayed Parameter Content
WP+
Active Power
(consumption only)
WP-
Active Power
(regenerated only)
WQLAG
Reactive Power
(lagging only)
WQLEAD
Reactive Power
(leading only)
Changes
displayed
parameters
Screen Display Description
EVENT
[WAVEFORM]
Displays the results of event
detection.
Shows the contents of events
detected between recording
start and stop.
[DETAIL]
[RMS WAVE]
[INRUSH]
Event
onitor
Even
list
Transient
SWELL DIP Interruption
Other
Indicates that six events have been recorded
Indicates that 46 events have been recorded
WAVEFORM DETAIL RMS WAVE INRUSH
Displays voltage waveforms and
current waveforms at event
detection alternately.
Displays list and details at
event detection.
Displays a graph showing rms
voltage fluctuations at event
detection.
Displays a graph showing
inrush current fluctuations at
event detection.
Displayed
when
INRUSH
exists
Details of
selected
event
Switches
between
voltage
waveform
and
current
waveform
Selects
cursor
event
Displayed
when DIP,
SWELL, or
INTER.
exists.
Press the key to store the displayed screen.
Approximately 30 to 40 screen images can be stored in
internal memory.
CHECK!
BMP data saved.
Data number : 4
Remaining volume [kB] :671
Press ESC to close window.
< Save screen image >
Sample Message
3197
Computer
Operate the instrument remotely.
(observation, control and screen
capture)
Download screen images and
measurement data from the
instrument's internal memory.
Analyze data recorded by the
instrument
USB Cable
You can also analyze recorded
measurement data with the 9624-
50. (Available soon)
3197 Communicator
• Remote operation
• Download
3197DataViewer
• Recorded measurement
data analysis
Event Recordable Qty. Description
Event data Total 50
Event List, details, voltage/current wave-
forms
Event voltage fluctuation graph
data
Total 20
Event voltage fluctuation graph for 4
seconds
Inrush current fluctuation graph
data
1
Inrush current fluctuation graph for 30
seconds
2
With attention to connector
orientation, insert the USB cable
plug into the port.
Remove the dust
cap from the USB
port
(The cap bends along
the dotted line shown
in the illustration on
the right and remains
attached to the unit.)
1
Dust Cap
Flip open

 Loading...


