60
Comparison Regression Curves
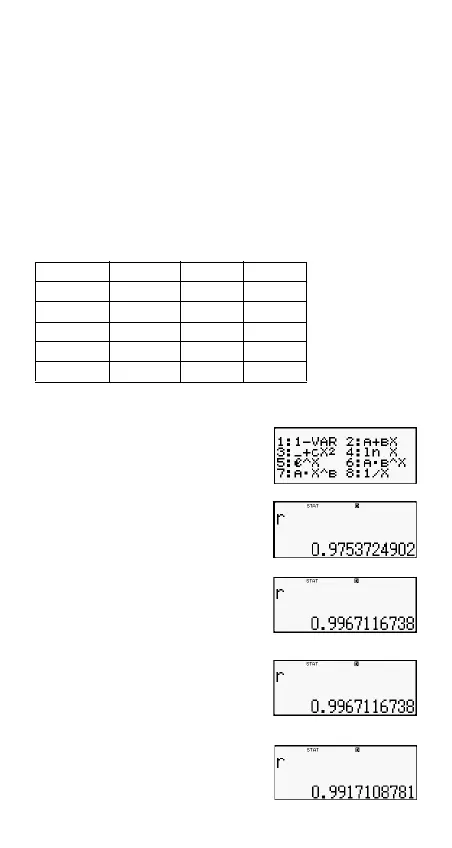
The following example uses the data input in as following table:
Compare the correlation coefficient for logarithmic, e
exponential, ab exponential, Power, and inverse regression.
(STAT) (Type)
(InX) (STAT)
(Reg) (r)
(STAT) (Type)
(e^X) (STAT)
(Reg) (r)
(STAT) (Type)
(A⋅B^X) (STAT)
(Reg) (r)
(STAT)
(Type)
(A
⋅
B^X)
(STAT)
(Reg)
(r)
xy xy
1.0 1.0 2.1 1.5
1.2 1.1 2.4 1.6
1.5 1.2 2.5 1.7
1.6 1.3 2.7 1.8
1.9 1.4 3.0 2.0
Syy y
2
y
()
2
n
----------------–
=
Sxy x
1–
()y
x
1
y
•
n
-------------------------–
=