What
Causes
Measurement
Errors?
Network
analysis
measurement
errors
can
be
separated
into
systematic
,
random, and
drift
errors
.
Correctable
systematic
errors
are
the
repeatable
errors
that
the system
can measure
. These
are
errors
due
to
mismatch
and
leakage
in
the
test setup
, isolation
between the
reference and
test
signal
paths
,
and
system
frequency
response
.
The
system
cannot
measure
and
correct
for
the
non-repeatable random
and drift
errors.
These
errors
aect
both
reection
and
transmission
measurements
.
Random errors
are measurement
variations
due
to
noise
and
connector
repeatability
.
Drift errors
include frequency
drift,
temperature
drift,
and
other
physical
changes
in
the
test setup
between calibration
and
measurement.
The
resulting
measurement
is
the vector
sum of
the test
device response
plus
all
error
terms
.
The
precise
eect
of
each error
term depends
upon its
magnitude and
phase
relationship
to
the
actual
test
device
response
.
In
most
high
frequency
measurements
the
systematic errors
are the
most
signicant
source
of
measurement
uncertainty
.
Since
each
of
these
errors
can
be
characterized,
their
eects can
be
eectively
removed
to
obtain
a
corrected
value
for
the
test
device
response
.
F
or
the
purpose
of
vector
accuracy
enhancement
these
uncertainties
are
quantied
as
directivity
,
source
match,
load
match, isolation
(crosstalk),
and
frequency
response
(tracking).
Each
of
these
systematic
errors
is
described
below
.
Random
and
drift
errors
cannot
be
precisely
quantied,
so
they
must
be
treated
as
producing a
cumulative
uncertainty
in
the
measured
data.
Directivity
Normally
a
device
that
can
separate
the
reverse
from
the
forward
traveling
waves
(a
directional
bridge
or
coupler)
is
used
to
detect
the
signal
reected from
the
test
device
.
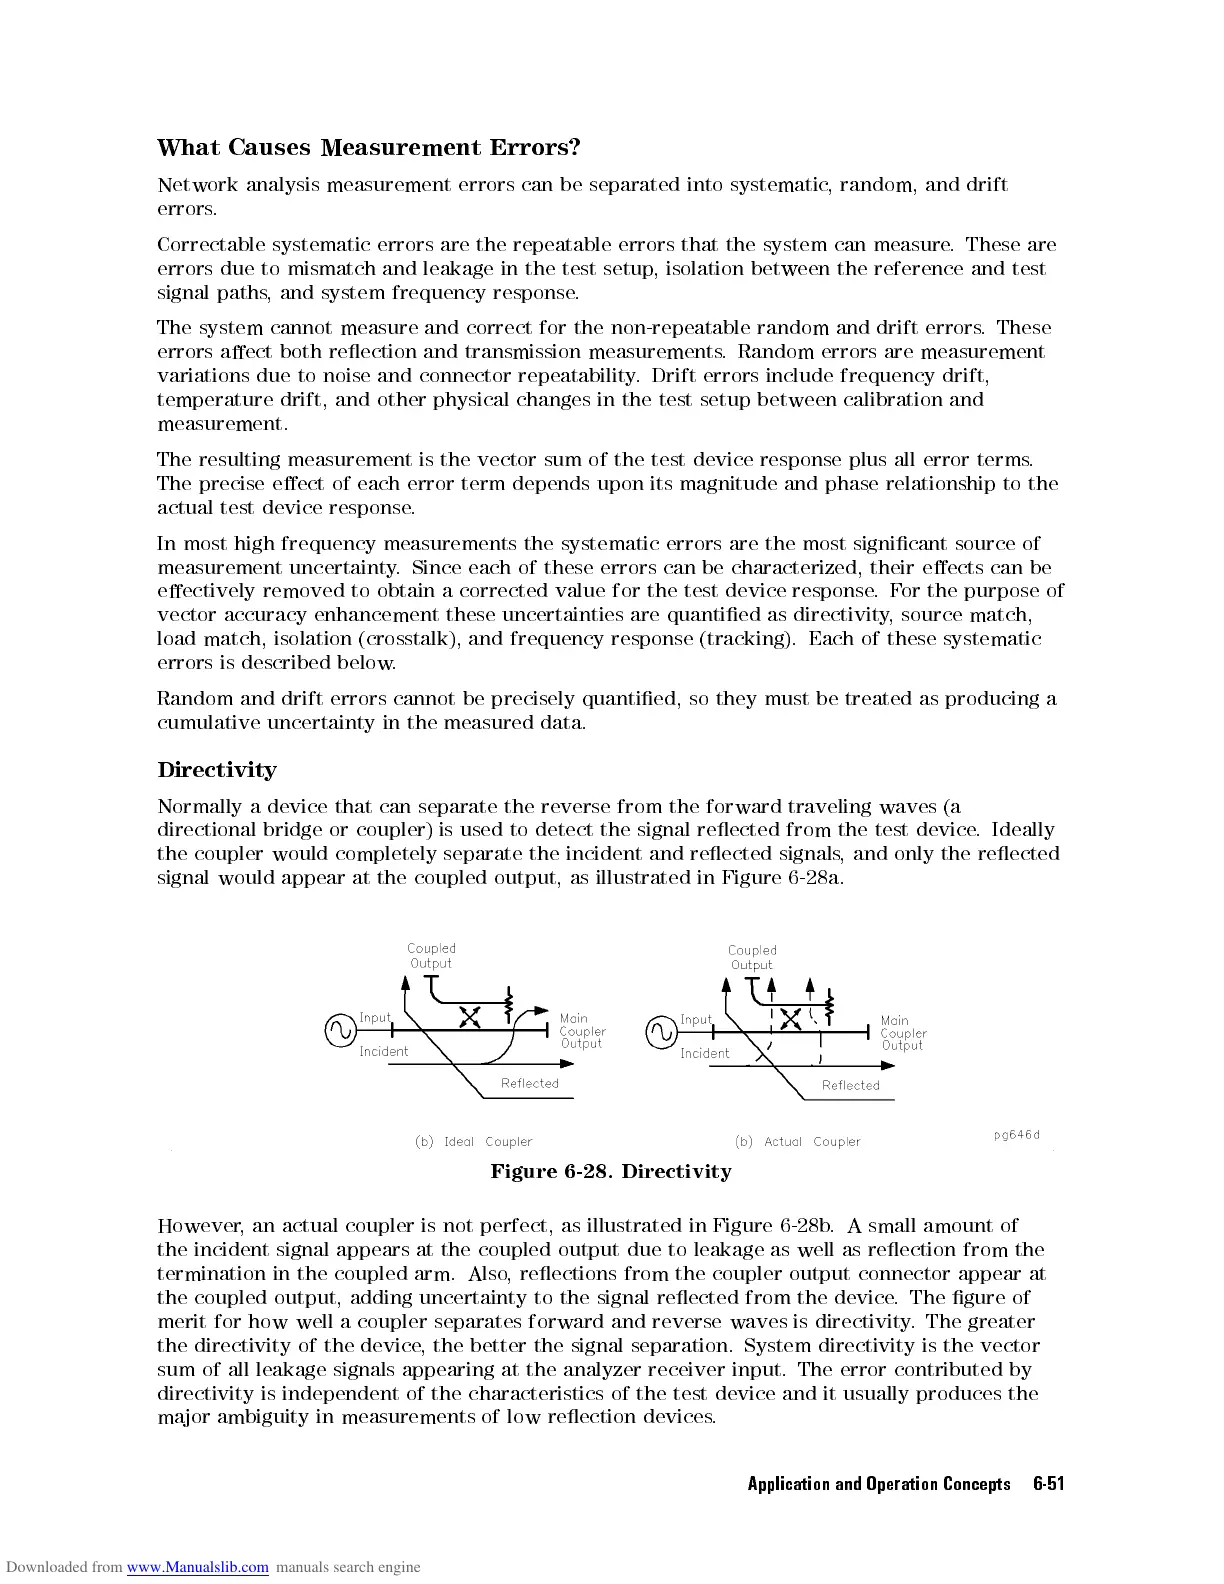
Ideally
the
coupler
would
completely
separate
the
incident
and
reected
signals
,and
only the
reected
signal
would
appear
at
the
coupled
output,
as
illustrated
in
Figure 6-28
a.
Figure 6-28. Directivity
However, an actual coupler is not perfect, as illustrated in Figure 6-28b
.
A small amount of
the incident signal appears at the coupled output due to leakage as well as reection
from the
termination in the coupled arm. Also
, reections from the coupler output connector appear at
the coupled output, adding uncertainty to the signal reected from the device. The gure of
merit for how well a coupler separates forward and reverse waves is directivity. The greater
the directivity of the device, the better the signal separation. System directivity is the vector
sum of all leakage signals appearing at the analyzer receiver input. The error contributed by
directivity is independent of the characteristics of the test device and it usually produces the
major ambiguity in measurements of low reection devices.
Application and Operation Concepts 6-51


 To Next Page
 Loading...