Minimum
allowable stop
frequencies.
The lowest
analyzer
measurement
frequency
is
30
kHz,
therefore for
each
value
of
n
there
is
a
minimum
allowable
stop
frequency
that can
be
used. That
is
,
the
minimum
stop
frequency
=n
x
30
kHz.
T
able 6-10
lists the
minimum
frequency
range that
can
be
used
for
each
value
of
n
for
low
pass
time
domain
measurements.
Reection
Measurements In
Time
Domain
Low
P
ass
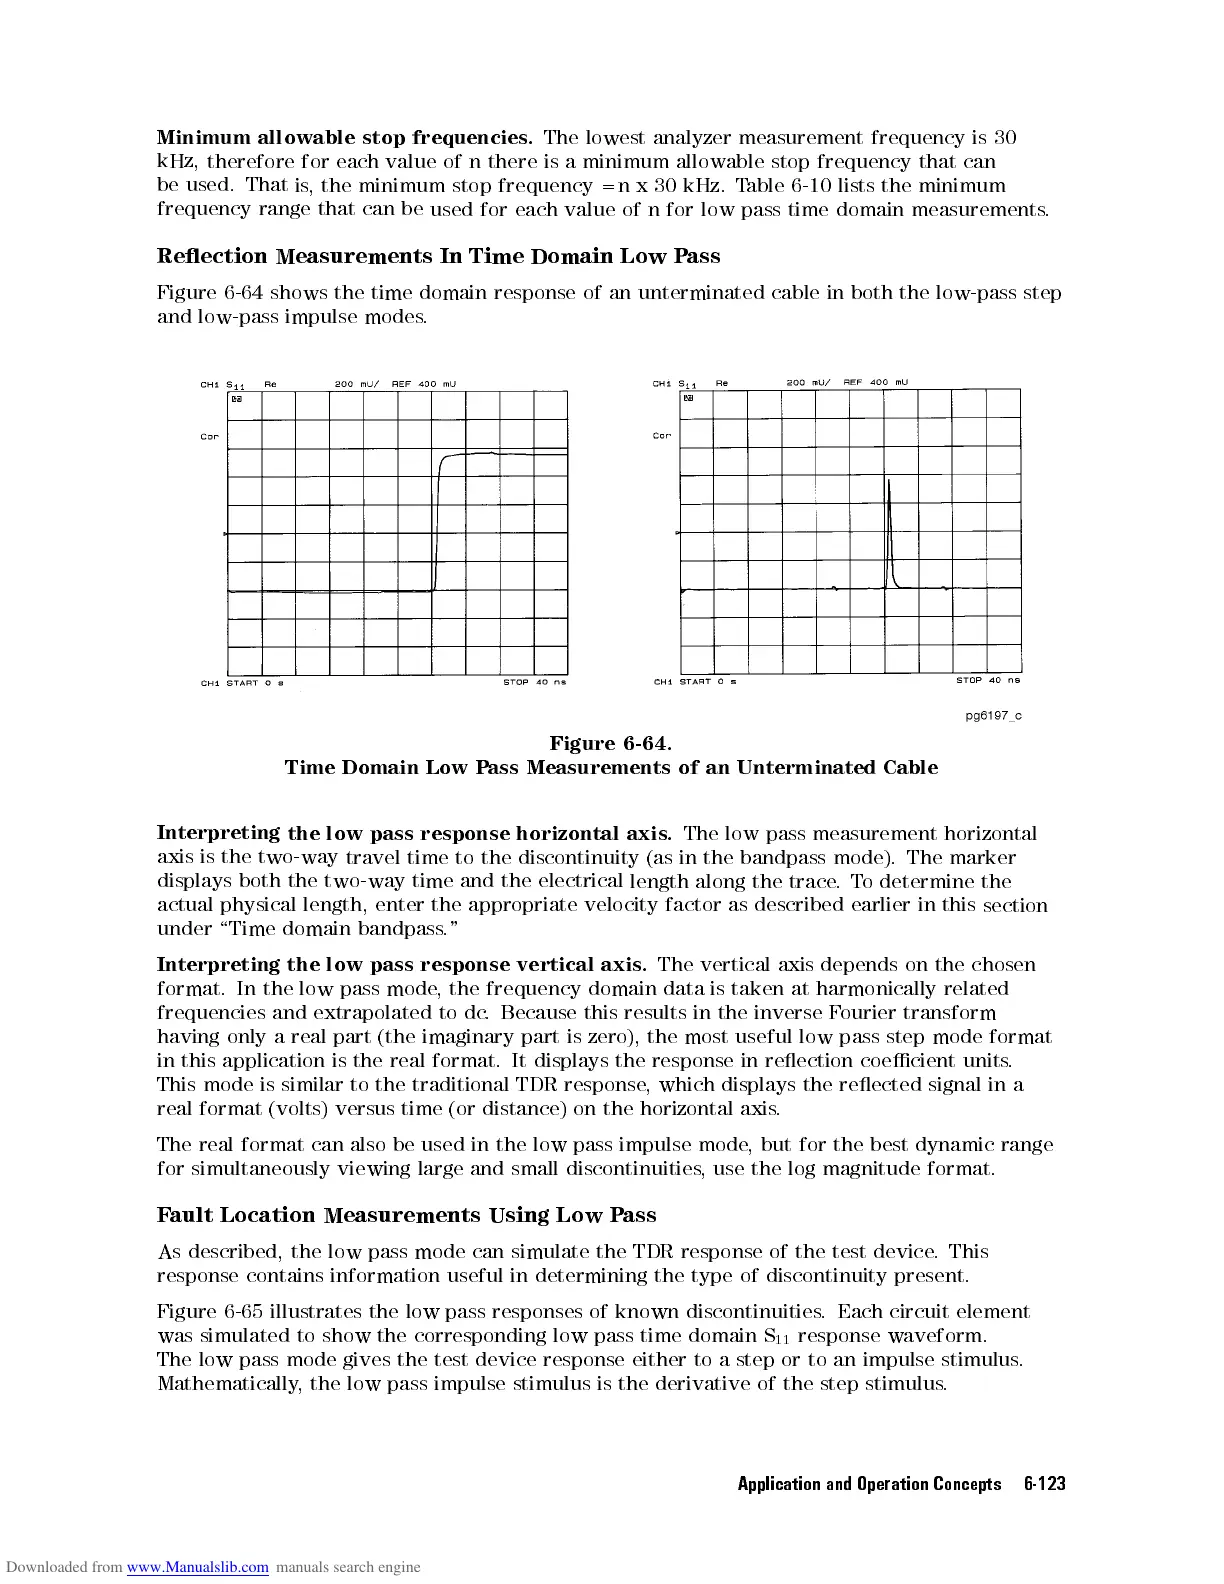
Figure
6-64
shows
the
time
domain
response
of
an
unterminated
cable
in
both
the
low-pass step
and
low-pass
impulse
modes
.
Figure
6-64.
Time
Domain
Low
P
ass
Measurements
of
an
Unterminated
Cable
Interpreting
the
low
pass
response
horizontal
axis
.
The
low
pass
measurement
horizontal
axis
is
the
two-way
travel
time
to
the
discontinuity
(as
in
the
bandpass
mode).
The
marker
displays
both
the
two-way
time
and
the
electrical
length
along
the
trace
.
T
o
determine
the
actual
physical
length,
enter
the
appropriate
velocity
factor
as
described
earlier
in
this
section
under
\Time
domain
bandpass
."
Interpreting
the
low
pass
response
vertical
axis
.
The vertical
axis depends
on the
chosen
format.
In
the
low
pass
mode
,
the
frequency domain
data is
taken at
harmonically
related
frequencies
and
extrapolated
to
dc
.
Because
this
results in
the inverse
Fourier
transform
having
only
a
real
part
(the
imaginary
part
is zero),
the most
useful low
pass step
mode
format
in this
application is
the real
format. It
displays the
response in
reection
coecient
units
.
This
mode
is
similar
to
the
traditional
TDR
response
,
which displays
the
reected
signal
in
a
real format (volts) versus time (or distance) on the horizontal axis
.
The real format can also be used in the low pass impulse mode
, but for the
best dynamic range
for simultaneously viewing large and small discontinuities
, use the log magnitude format.
Fault Location
Measurements Using Low P
ass
As described, the low
pass mode can simulate the TDR response of the test device
. This
response contains information useful in
determining the type of discontinuity present.
Figure 6-65 illustrates the low pass responses of known discontinuities. Each circuit element
was simulated to show the corresponding low pass time domain S
11
response waveform.
The low pass mode gives the test device response either to a step or to an impulse stimulus.
Mathematically, the low pass impulse stimulus is the derivative of the step stimulus.
Application and Operation Concepts 6-123
 Loading...


