241
Print Quality
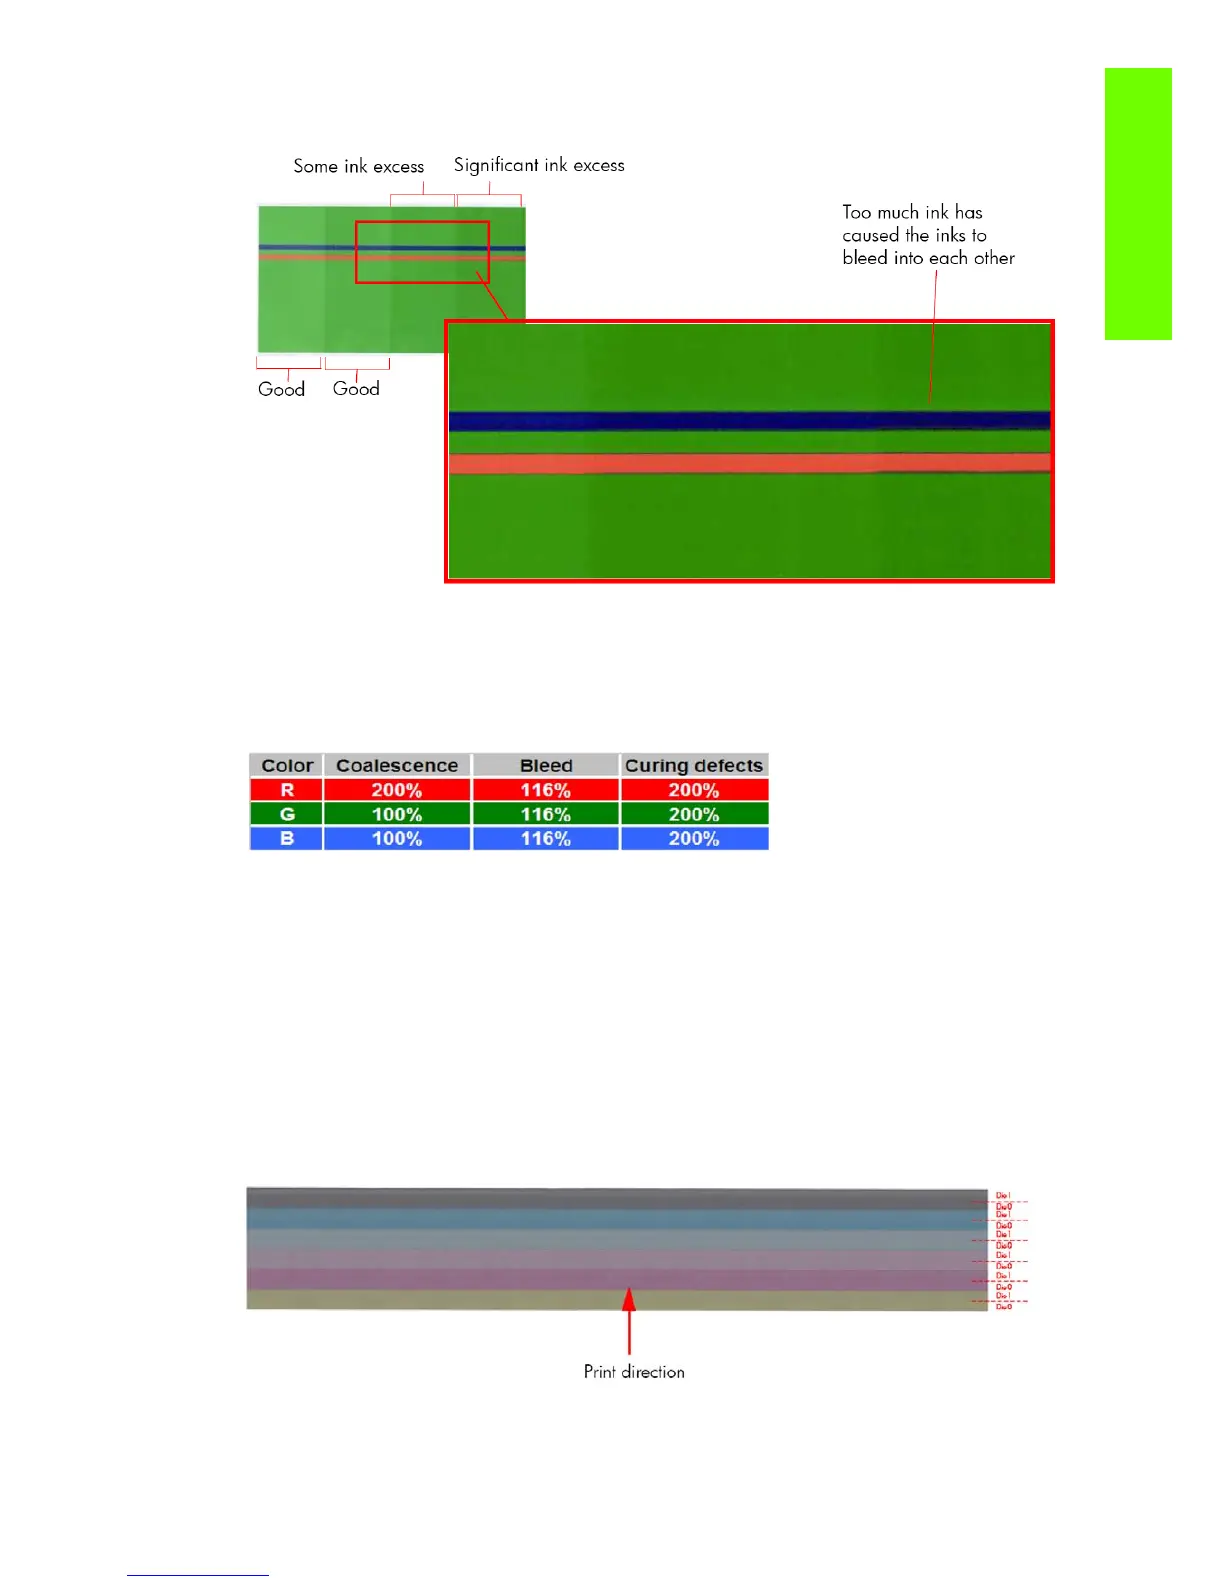
To evaluate the Drying test plot look at the last square (in order of increasing ink quantity) that shows no
coalescence, banding or bleed effects.
To evaluate the Curing test plot look at the squares that show ink smudge when touched (see picture) or
that show an ‘oily finish’ (which is more likely).
The following table shows the maximum quantity of ink (the darkest patch) that can be printed using HP
Permanent Gloss Adhesive Vinyl without producing any of the issues previously stated. The
evaluation is performed in the secondary colors only:
Corrective Action
At the bottom of edge of each block of primary color, and at the top of each secondary color, there is a
percentage scale which indicates the level of ink used to print that portion of the diagnostic print. This
information can be used to adjust the ink saturation levels in the RIP used by the customer.
2.6 Scan Axis check
This plot shows any defect in the Encoder Strip along the Scan Axis. To print this test plot go to Menu
List>2. Image Quality Plot>2.6 Scan Axis Check.
Any defects in the encoder strip will have a detrimental affect on the image quality of the printer,
specifically in the area where the encoder is defective. The defect is revealed by means of an interference
or Vernier pattern that spans the whole Scan Axis of the printer.
 Loading...