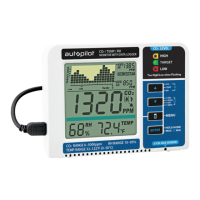
LCD DISPLAY
1. Trend Chart
1A: x10 multiplier
2. AVG HI reading of chart
3. Measurement Category
(indicates what is on display:
CO
2
, Temp or RH)
4. Automatic cycle between CO
2
, Temp and
RH charts
5. AVG LO reading of chart
6. Plant or Human mode
7. Audible alarm On/O
8. Main Menu
9. Temperature reading
10. RH reading
11. CO
2
PPM reading
12. Time per interval
(indicates the amount of time
between readings)
13. Automatic cycle between Zoom Levels
14. Zoom Level of time
(indicates the chart’s span of time)
15. Target Zone indicator
6
 Loading...