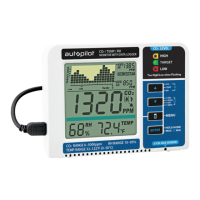
TREND CHART
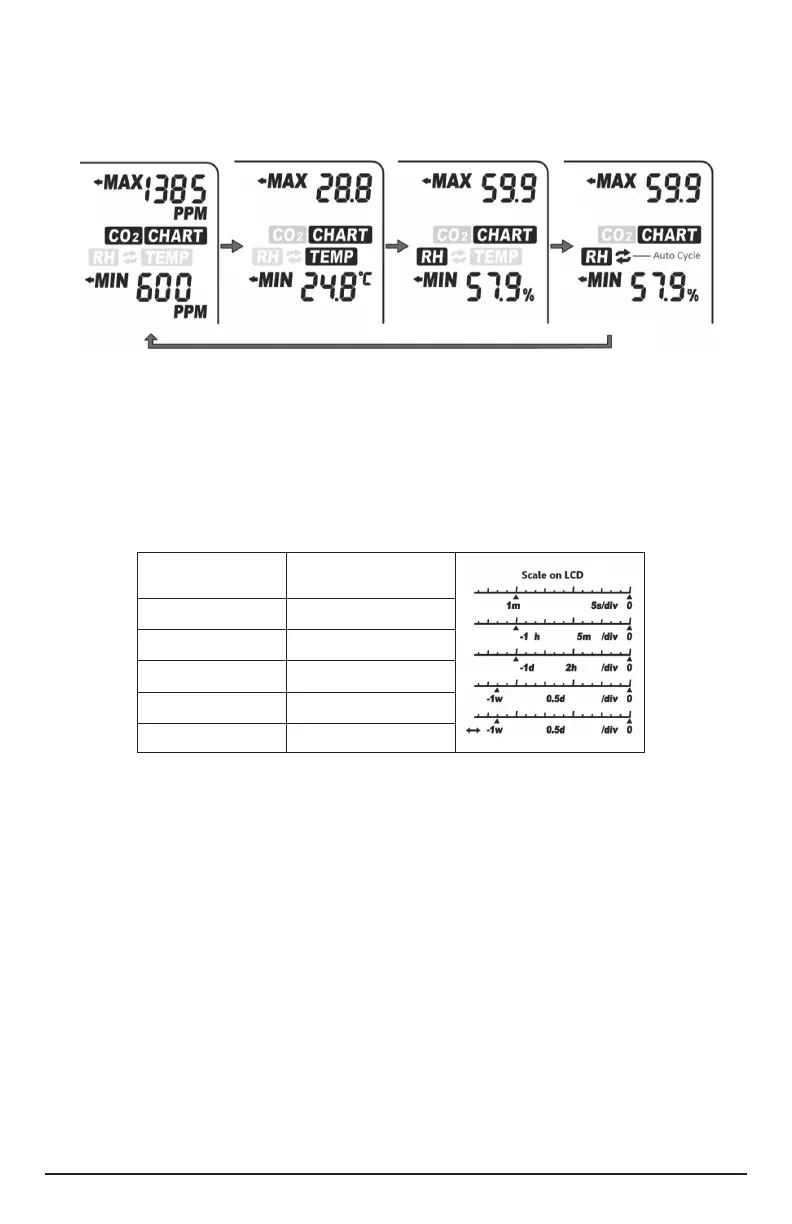
The Trend Chart (1) displays the past readings for any of the three parameters (CO
2
/Temp/RH). There
are 4 modes that can be toggled by using UP key: CO
2
, TEMP, RH, and Cycle (automatically cycles
through CO
2
/Temp/RH), as shown below.
TREND CHART ZOOM
Below is a table that shows the available Zoom Levels for all parameters (CO
2
, Temp and RH) as well
as the duration of each interval for corresponding Zoom Levels:
Using DOWN will toggle the available Zoom Levels for each parameter. Note that in addition to the
Zoom Levels for each parameter, there is an option that will automatically cycle between the Zoom
Levels. This can be achieved just by pressing DOWN until icon (13) appears at the bottom left of the
chart.
AVG HI / AVG LO
At the top right corner of the display, there are two numerical indicators: AVG HI (2) and AVG LO
(5). As the Zoom Level is changed, the : AVG HI and AVG LO values will reect the average high and
average low values on the chart of the selected parameter (CO
2
, Temp and RH). At startup, the unit
will automatically display values for CO
2
.
NOTE: Trend chart contains a maximum of 17 sets of recorded data at one time. After the chart is full
the data is FIFO (rst-in, rst-out).
Zoom Level
(Time Span) (14)
Time Per Interval (12)
1m (minute) 5sec /div
1h (hour) 5m/div
1d (day) 2h/div
1w (week) 0.5d/div
Auto Cycle Zoom Cycle
8

 Loading...