CHOOSING AN APPLICATION AND ENCLOSURE
5
Study the sample curves on pages
5, 6 and 7 and read each explanation
carefully. The charts that follow specify
enclosure volumes and vent dimensions
(where applicable) and indicate the
shape of the response curve both
in-car and out-of-car.
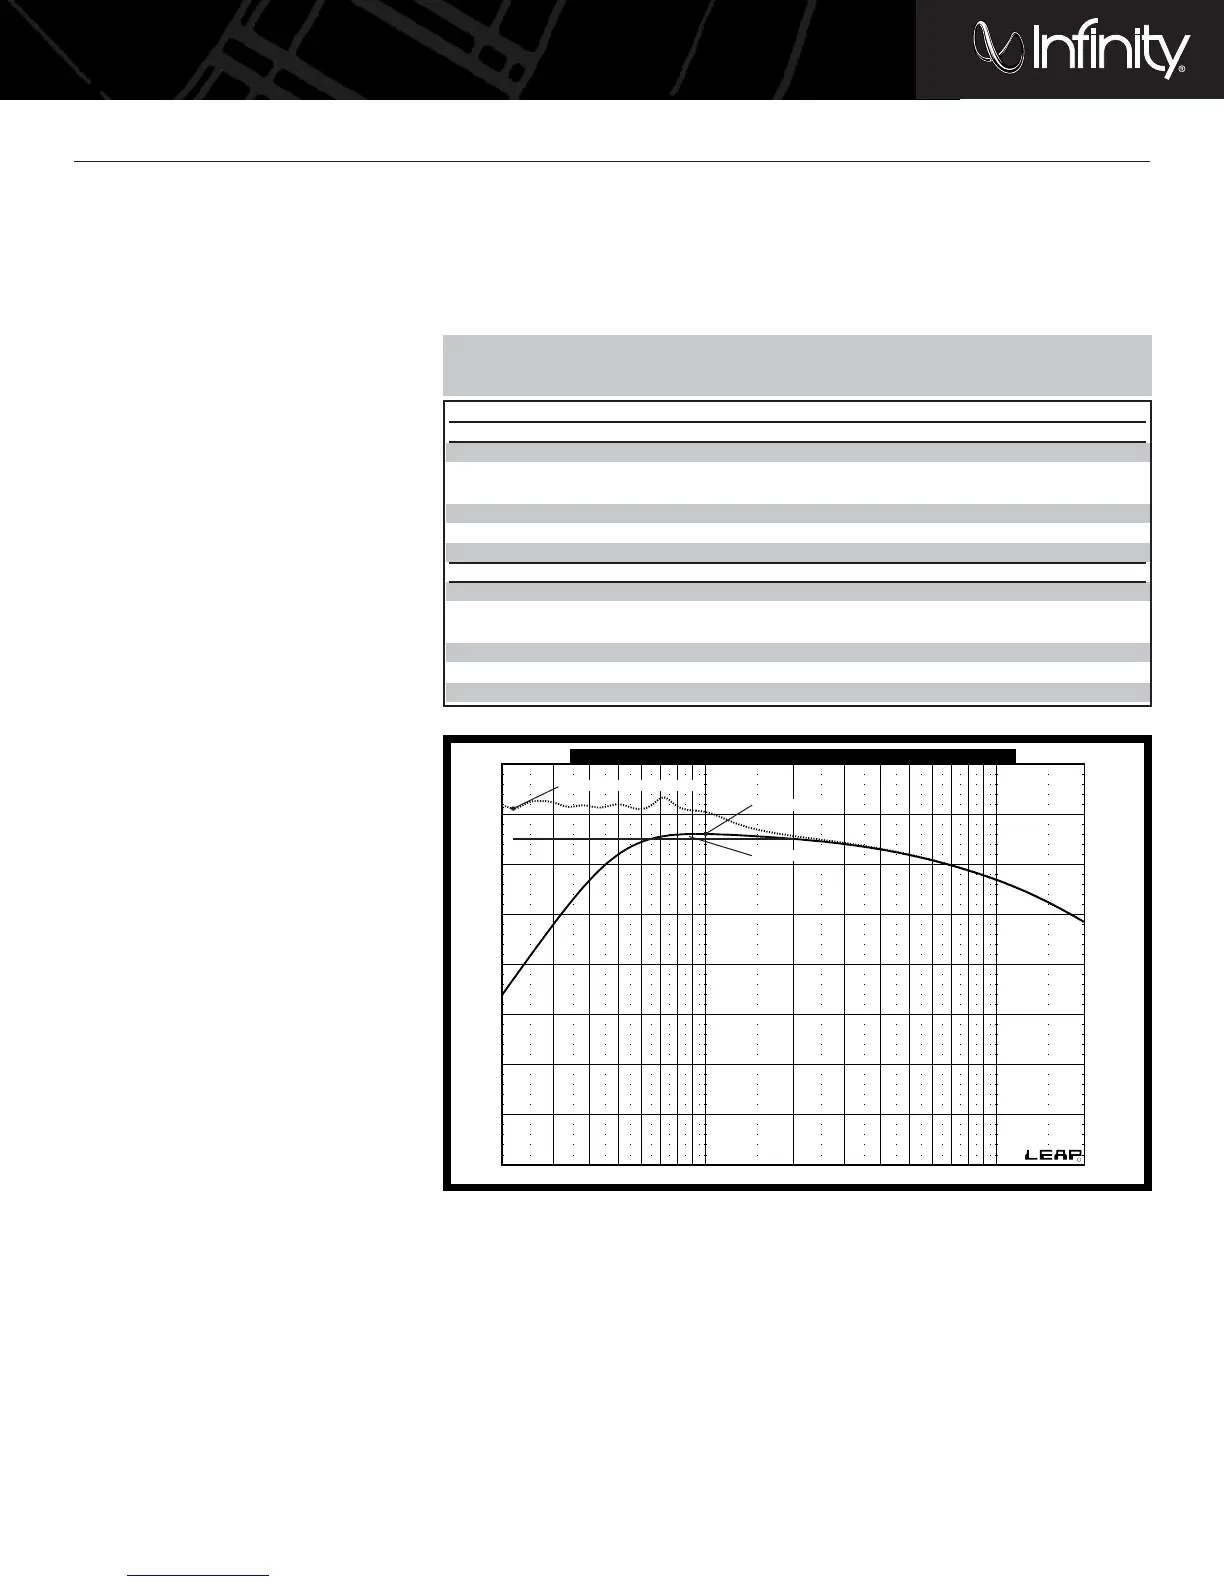
PERFECT VQ IN SEALED ENCLOSURES
The sample curve below shows typical
in-car and out-of-car frequency response
curves for a Perfect VQ woofer in a
sealed enclosure. The charts that follow
give some sealed enclosure volumes
that may be used for each of the
Perfect VQ woofers. The associated
terms (defined below) describe the
woofer’s performance in the enclosure.
• Vb – Enclosure volume
• F3 –Frequency at which the subwoofer’s
output is attenuated by 3dB
• Fmax – Frequency at which output is at
a maximum
• Ripple – Deviation from flat response
above roll-off
• Insert – Indicates which insert should
be used (LowQ, MidQ or none)
• In-car level @ 20Hz – Indicates level
at the lowest frequency. A positive
number indicates a response that
rises with decreasing frequency and a
negative number indicates a response
the falls with decreasing frequency.
(continued)
The highlighted combinations will provide the best compromise between low-frequency extension and
flat response and high-output, and are considered optimum. Higher ripple values indicate a “boomier”
sound and provide higher output at the expense of flat frequency response and low-frequency extension.
Vb (ft^3) F3 (Hz) Fmax (Hz) Ripple (dB) Insert In-Car Level @ 20Hz
Kappa Perfect10 VQ and 10d VQ, Sealed
0.3 58 100 0.3 low –2
0.4 53 100 –1 low 0
0.5 45 80 1 mid 1
0.75 42 90 0 mid 3
135542none 4
infinite baffle 26 90 –0.5 none 11
Kappa Perfect12 VQ and 12d VQ, Sealed
0.4 60 100 2 low –4
0.6 58 100 0 low 0
0.75 47 76 2 mid –2
142620.75 mid 1
1.25 35 50 2 none 3
infinite baffle 20 80 0 none 15
 Loading...