29
To Understand Performance Statistics Display
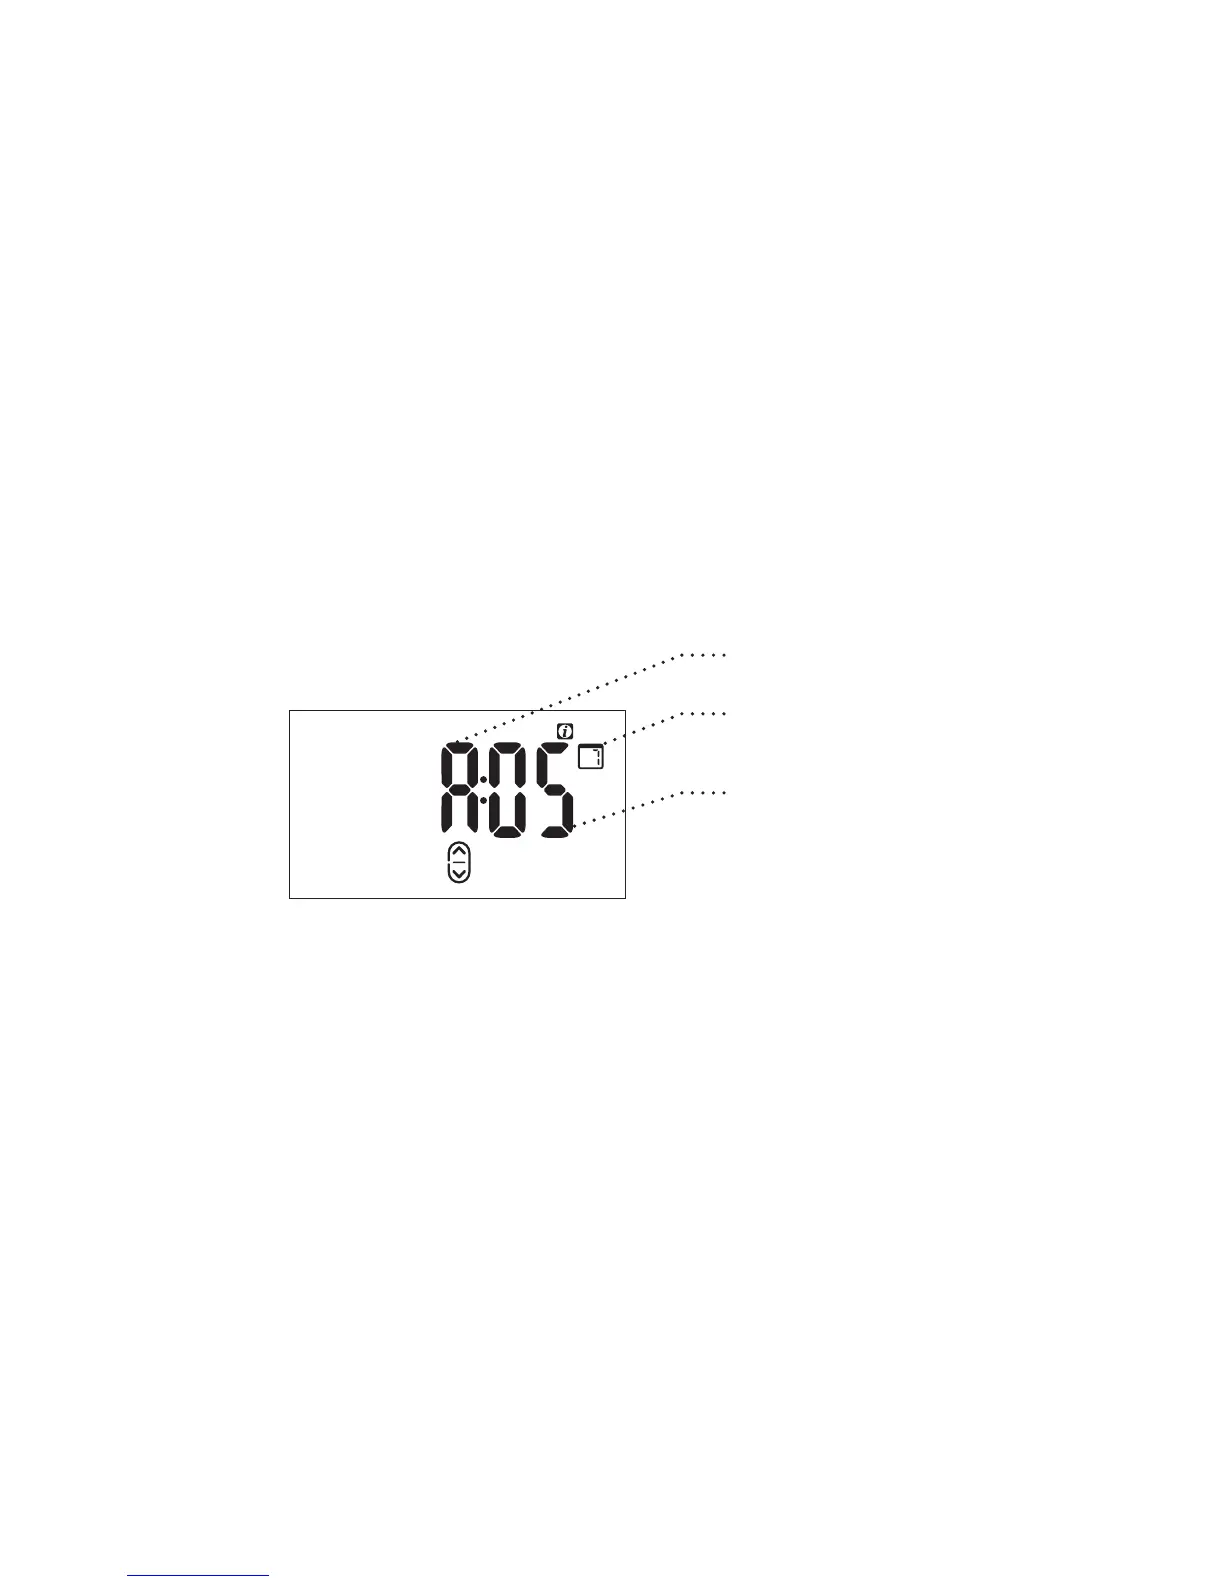
Performance statistics are expressed as shown in the example:
a letter and a value together with the Report Period.
The letter corresponds to the statistic type and range from A to F.
The value shows the performance for that particular statistic. The
report period varies depending on the time frame selected.
Performance Display
Report Period
Value
Statistic type