32
HIGH FREQUENCY SIGNAL PATH GAIN
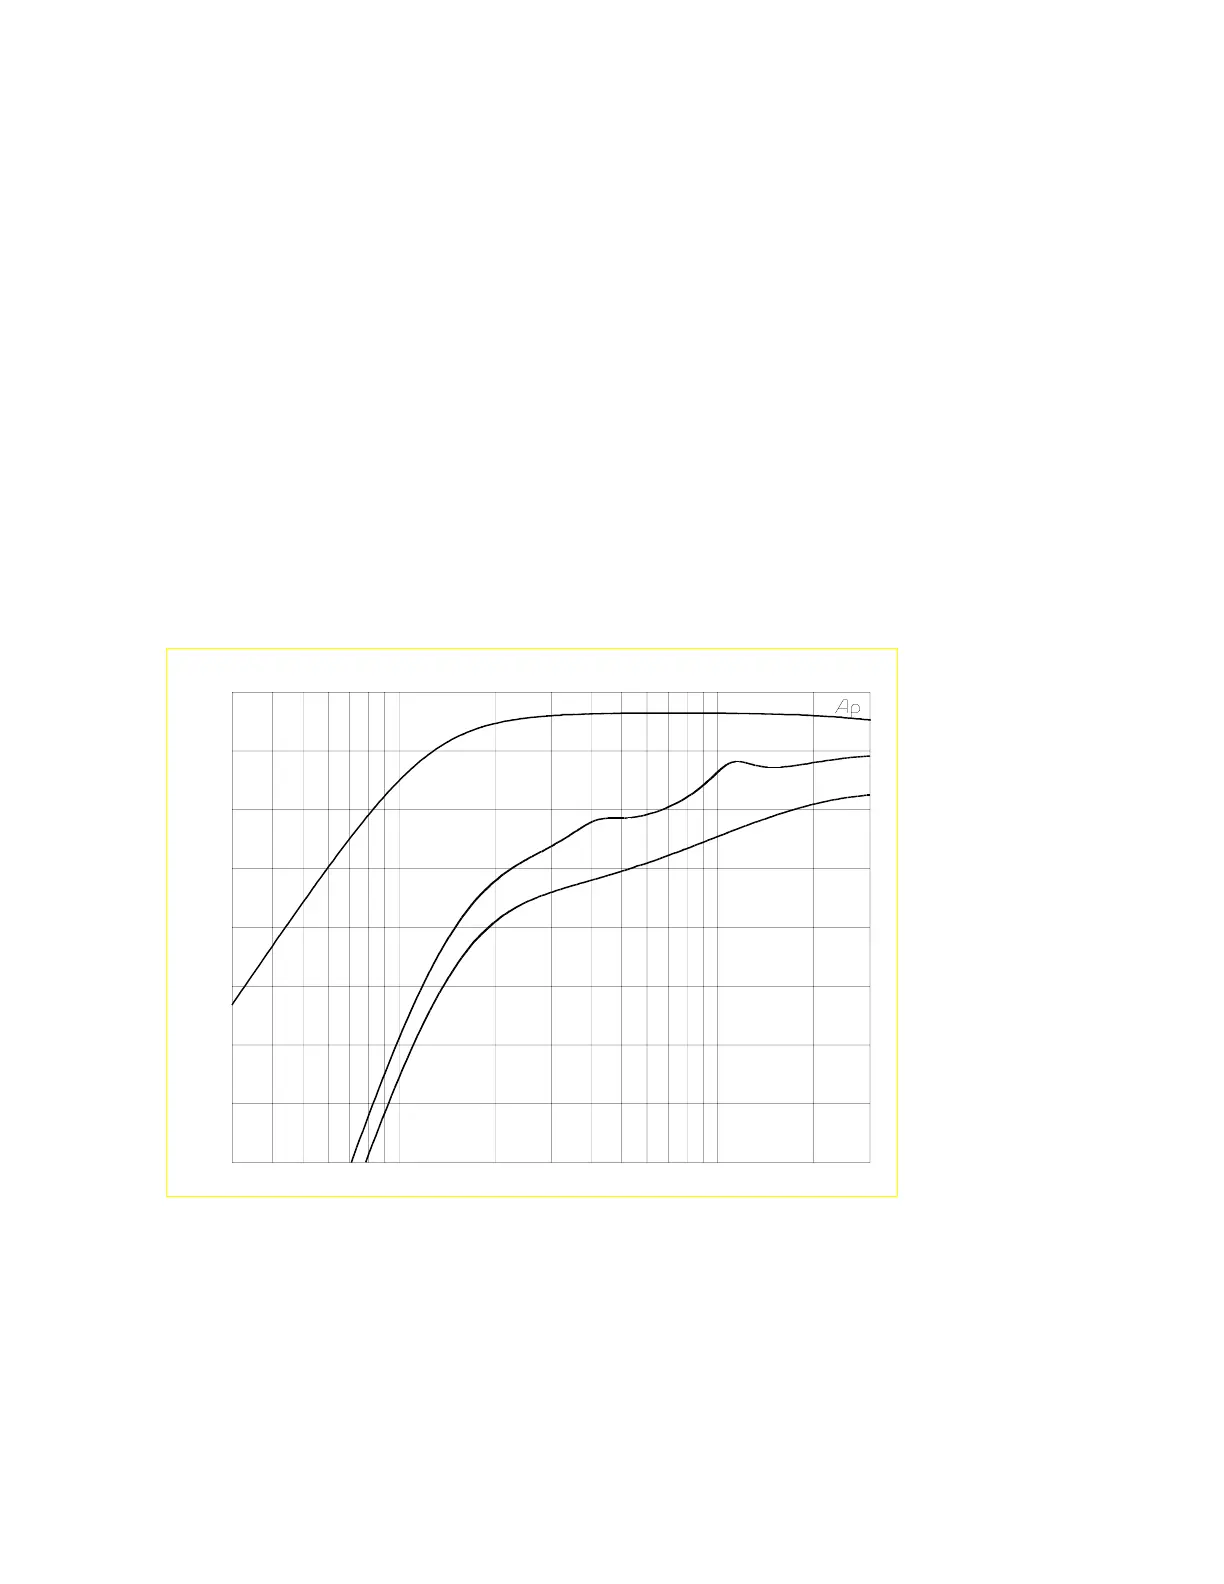
The curves in the figure below, which are taken with trimmer R4 at minimum (fully ccw) plot
the frequency response from a +4dBu input signal at the outputs of U1 pin 1, U1 pin 7 and U4
pin 1.
U1A acts as a second order high pass filter as shown by the top curve. U1B acts as a buffer to
the passive shelving equalization R13, C5 etc. and provides a further second order high pass
filter. U4 A and B along with U8B form twin bell equalization boosts centered at about 4.3KHz
and 11KHz.
The response at any point along the signal path relies on an accurate frequency response
characteristic from preceding stages. The curves in the figure allow ready identification of a
stage, which is causing frequency response errors. An inaccuracy in a single section can result in
gross inaccuracies in the overall response result.
UDIO PRECISION LSR28_H1
vs
High Frequency Section
-40.00
-35.00
-30.00
-25.00
-20.00
-15.00
-10.00
-5.000
0.0
LEVEL (dBu)
300 1k 10k 30k
FREQ(Hz)